


Color contours and gradients can be very helpful to visualize the forces/stresses of plates and wall panels. But did you know there are other design tools that can be helpful in analyzing and understanding these contours? The family of Internal Force Summation Tools (IFST, IFST Wall and IFST Slab) gives users the ability to "cut through" elements in the model and produce a summation of forces that corresponds with a given load combination. For more information about these tools, visit the articles listed below:


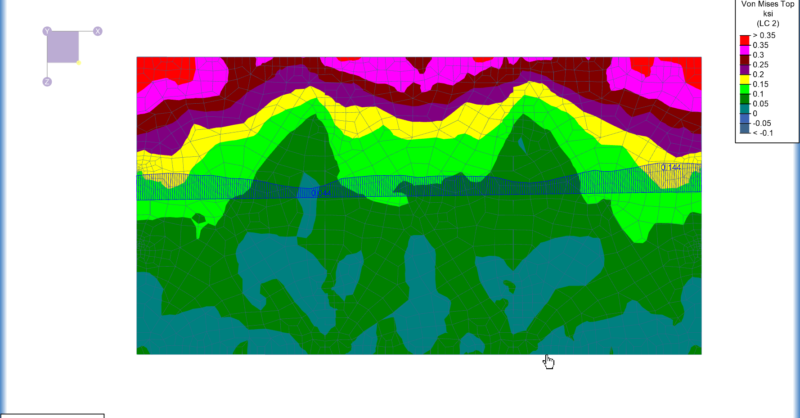
Besides the family of Internal Force Summation Tools, there is another useful tool called the Contour Diagram tool. The Contour Diagram tool allows users to see what the forces/stresses are along a defined cut within the Color Contours/Gradients. To utilize this tool, first click the Contour Diagram button found at the bottom of the Selection Toolbar or found in the Results tab. Next, click the start and end nodes that define the location and direction of the cut you wish to make.
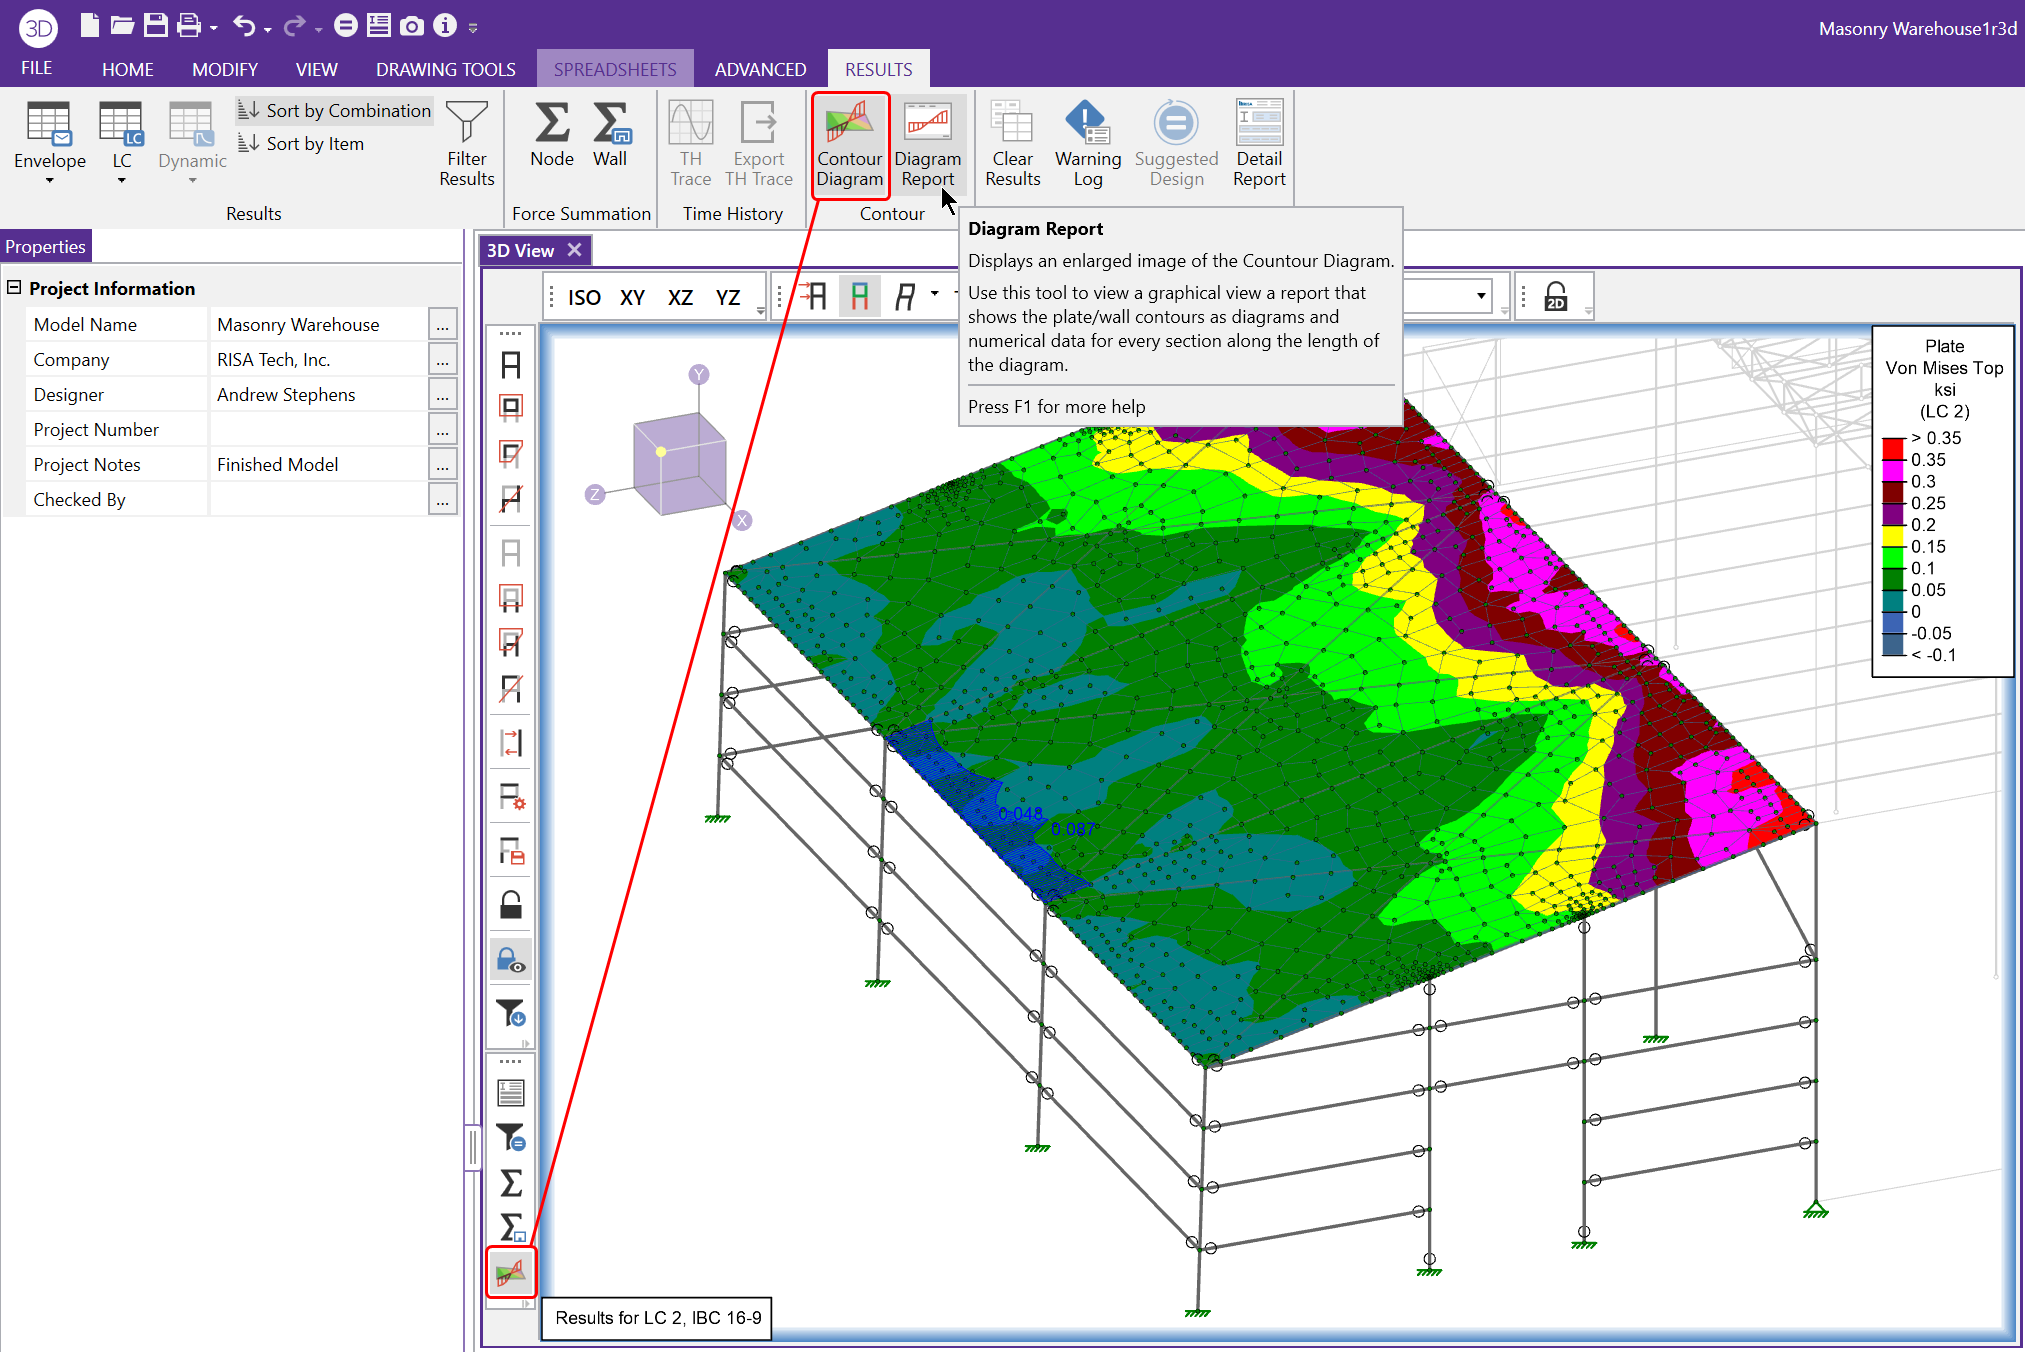
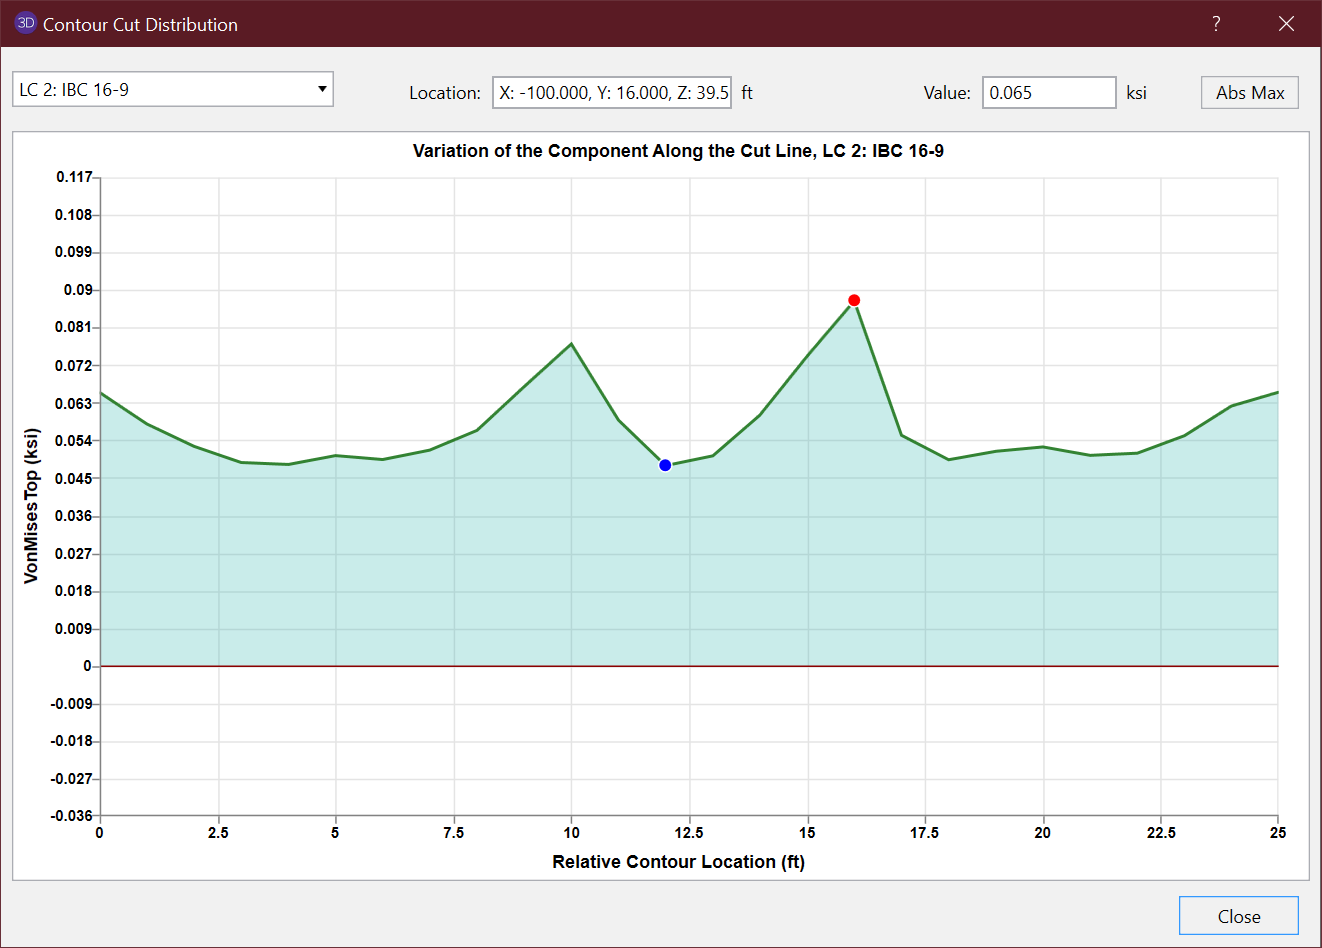
Once you have a contour diagram showing the results you are interested in, you can navigate to the Results tab and choose the Diagram Report option.

In the Diagram Report, you will see an enhanced view of the cut that was created using the Contour Diagram tool. Within the dialogue users can change the Load Combination that is being viewed while also evaluating values all along the length of the diagram. The Maximum and Minimum values are marked with a red and blue dot (respectively). Overall, the Contour Diagram and Diagram Report make it easier to investigate specific results of a contour plot.