


RISAFloor does not record the applied area loads in a spreadsheet. To simplify modeling, it instead assumes a default area load over the entire diaphragm area. Additionally, you are free to apply area loads beyond the default loads. Whatever is drawn last will be considered the applied loading unless you are using an additive area load which would then be additive to the loads drawn “underneath” it.
For more information about additive area loads, read the

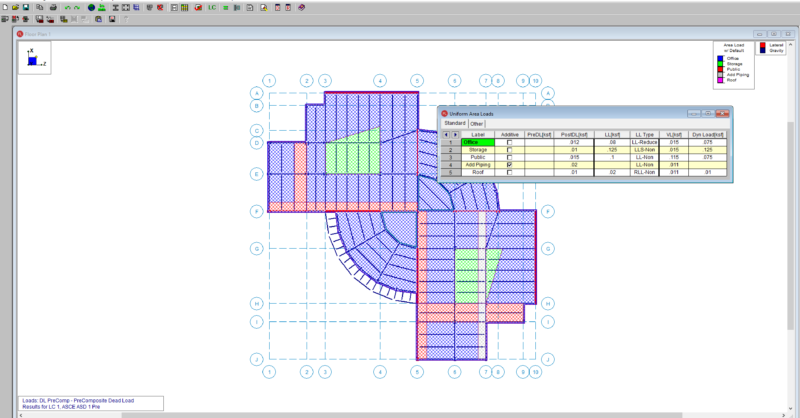
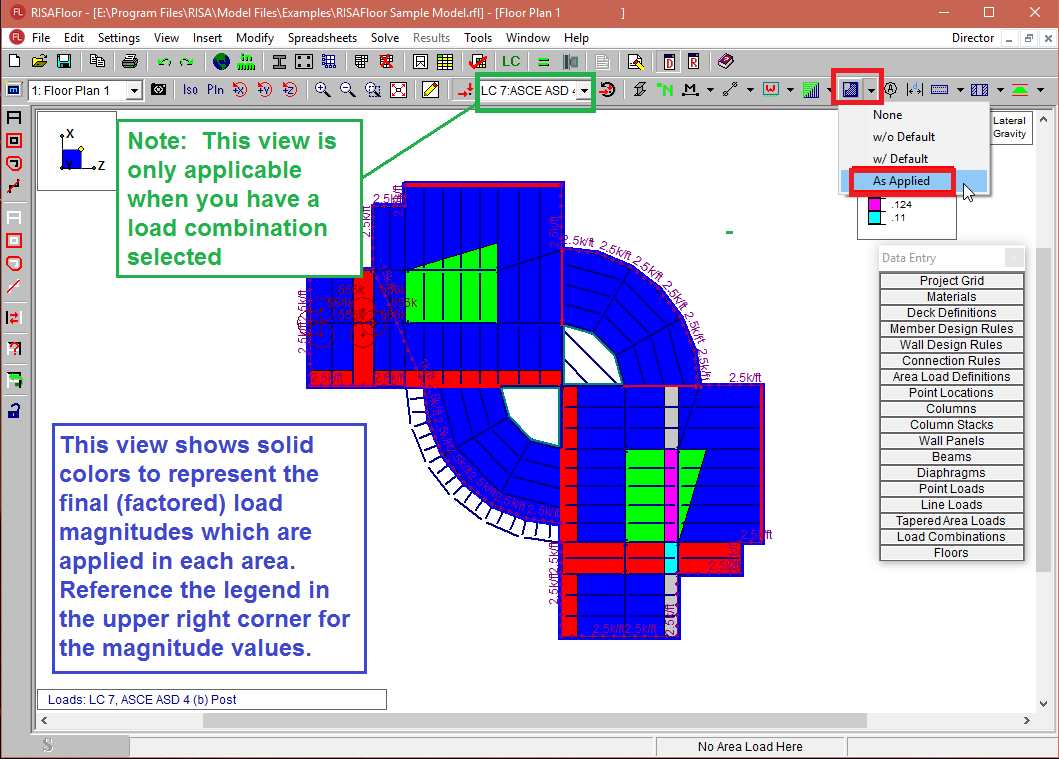
Therefore, to verify the applied loading, you must do it graphically using the Show Area Load Types toggle button from the Window toolbar. RISAFloor includes three very helpful graphical viewing options for the area loads:
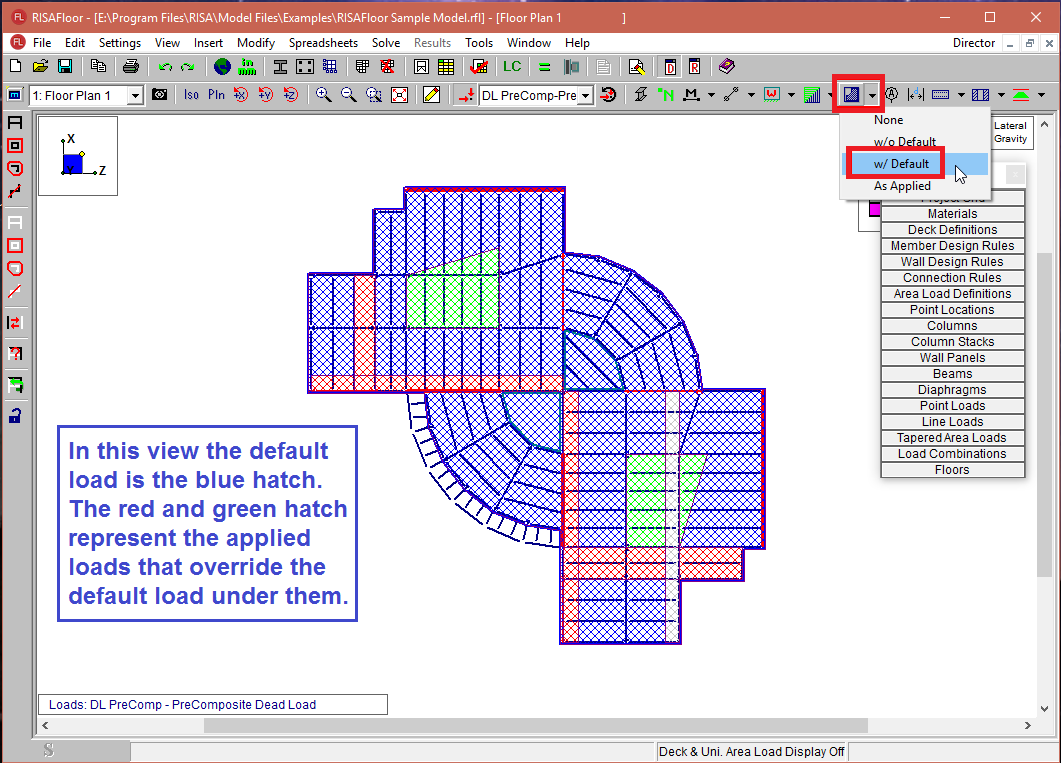
1. View all the applied loading, including the default area load.
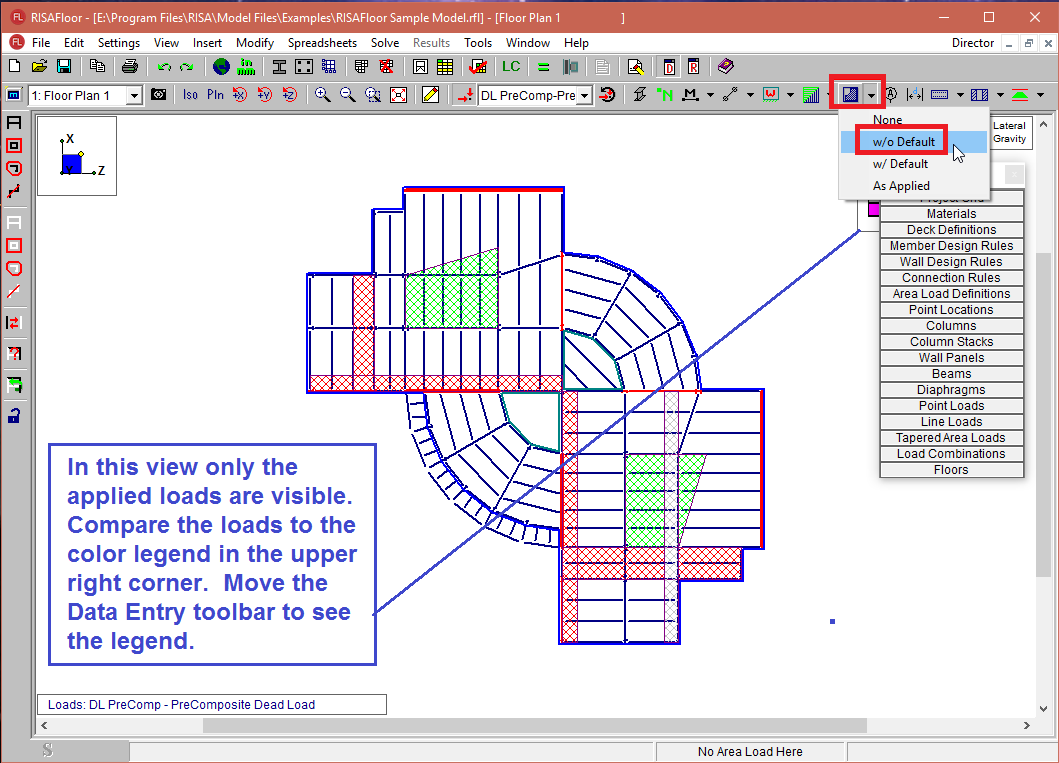
2. View only the applied area load (default is hidden).
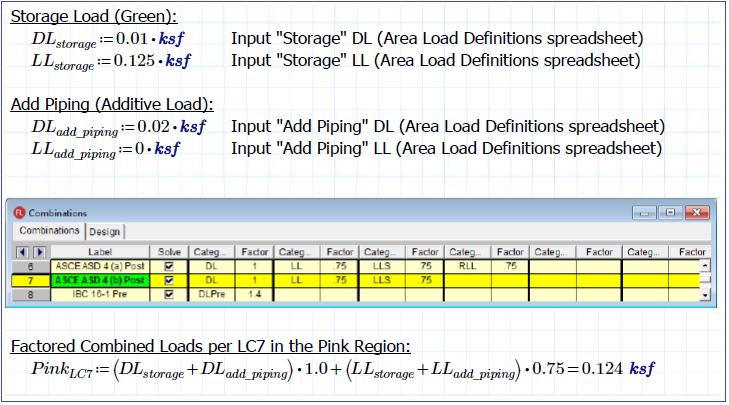
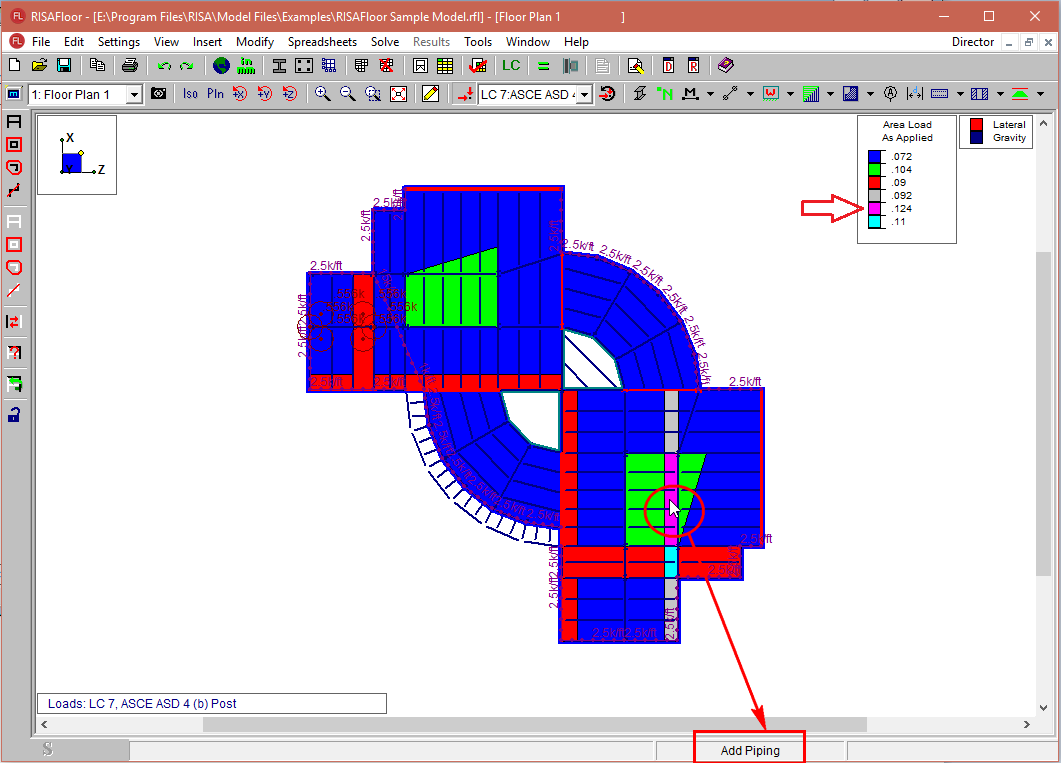
3. View the combined area loads to see how the load will actually be applied in each load combination. This option includes a legend to show the factored magnitudes of the applied loading.
You can also hover your cursor over any area and see the applied Area Load reported in the Status Bar.
Use this information to compare to your input loading and load combinations to verify the applied loads.