View XLS Drift Report
The program now includes the option to produce an XLS report with multiple data sheets for lateral drift results. These results can include or exclude P-Delta combinations or only 1st order lateral results.
To view the XLS Drift Report:
-
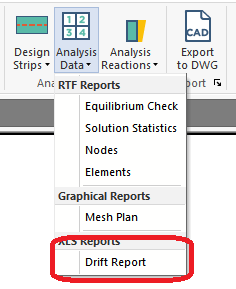
Go to the Reports ribbon Analysis Reports panel and click on the Analysis Data icon and select Drift Report.
Note: Prerequisite to producing the report, the model should be run in Multi-Level mode and contain at least a single combination with lateral loads included.
-
When you select the option to produce the drift report, the following dialog in the image below will appear, allowing you to customize the report. This dialog includes a list of design combinations for which a Multi-Level solution has been generated. You can custom-select which combination(s) to produce the report for.
In addition, you can enter the allowable drift % as well as the P-Delta Maximum Drift Amplification Factor to check against.
Note: The allowable drift and moment amplification is that entered by you. It is your responsibility to apply any displacement amplification factor (Cd) within the value entered as allowable. These two inputs within this dialog are separate and do not affect those located in the ‘Settings’ tab of the Result View panel, which are intended for graphical code check of drift and amplification due to P-Delta.
You can also select which direction to produce the report for. Options include global X and Y as well as the combined drift.
Click on image to enlarge
-
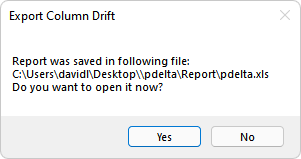
Upon selecting OK, the program will produce a message showing the path location of the XLS file and prompt you to open the file automatically. The file will open to the default application compatible with XLS files. This is typically Microsoft Excel® or another equivalent application.
The XLS file will generate 7 unique sheets of data. These include Stations, Displacements, Drift at Columns, Average Drift, Max Drift Envelope, Average Drift Envelope, and Drift Amplification Factor. Each sheet is described briefly below with an illustrative example
Stations
This report sheet lists all columns in the model starting at the upper-most plane and working down. The column label, global coordinates and height are shown.
Click on image to enlarge
Displacements
This report sheet shows the displacements for all columns for the top and bottom location of the column. The selected combinations for the produced results are listed along with the combination analysis/design option type. The columns are reported by plane listed top-down.
Click on image to enlarge
Drift at Columns
This report shows the inter-story drift values (in or mm) for each column, at each plane, for the selected combinations and directions. The combination analysis/design option type is listed.
Click on image to enlarge
Additional results shown on this sheet are for code check against the maximum allowable drift %. The % drift for the selected directions are shown as well as the allowable %. If any of the direction values (X, Y or combined) exceed the allowable, the program will flag this row (indicating a single column for a single load combination result) as NG. If the values are less than the allowable the row will be flagged as OK.
Click on image to enlarge
Average Drift
This report shows the average inter-story drift values (in or mm) for all columns at a plane and for each selected combination and direction. The combination analysis/design option type is listed. To produce the values, the program sums the drift for all columns and divides by the number of columns. This is done for each direction and combination.
Click on image to enlarge
Additional results shown on this sheet are for code check against the maximum allowable drift %. The % drift for the selected directions are shown as well as the allowable %. If any of the direction values (X, Y or combined) exceed the allowable the program will flag this row (indicating a single column for a single load combination result) as NG. If the values are less than allowable the row will be flagged as OK. Note that for each plane and combination, the program will bold the text for those drift % values that exceed the allowable.
Click on image to enlarge
Maximum Drift Envelope
This sheet reports the maximum drift % against the maximum allowable drift % for all combinations and all columns at a plane. The % drift for the selected directions is shown as well as the allowable %. If any of the direction values (X, Y or combined) exceed the allowable the program will flag this row (indicating a single column for a single load combination result) as NG. If the values are less than allowable the row will be flagged as OK.
Click on image to enlarge
Average Drift Envelope
This sheet reports the maximum average drift % against the maximum allowable drift % for all combinations and all columns at a plane. The % drift for the selected directions are shown as well as the allowable %. If any of the direction values (X, Y or combined) exceed the allowable, the program will flag this row (indicating a single column for a single load combination result) as NG. If the values are less than allowable the row will be flagged as OK.
Click on image to enlarge
Drift Amplification Factor
This sheet reports the directional drift amplification % for selected P-Delta combinations. Results are shown for each column at every plane in the structure and code checked against maximum allowable % defined by you. If any of the direction values (X, Y or combined) exceed the allowable, the program will flag this row (indicating a single column for a single load combination result) as NG. If the values are less than allowable, the row will be flagged as OK. The ratio can be taken as the 2nd order drift/1st order drift. The program calculates drift values at the top and bottom of each column. The program calculates drifts at both locations and uses the maximum ratio for this report.
Click on image to enlarge


