View Two-Way (Punching) Shear Check Results
Once the shear check has been completed, you can review the results graphically and through tabular reports. The program will report shear reinforcement calculated by the program both graphically and in tabular format as well. The interpret tabular punching shear reinforcement outputs topic describes the difference in output for Studs or Stirrups.
View Punching Shear Graphical Results
Once the shear check has been completed, you can review the results of the shear check graphically.
To view graphical punching shear results:
-
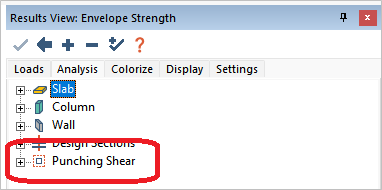
Click the Analysis tab in the Results View panel.
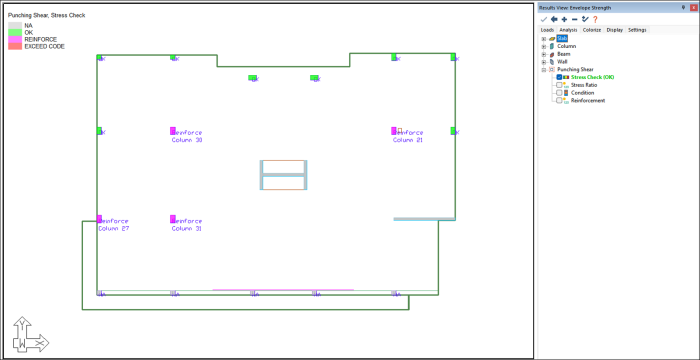
A punching shear tree appears in the list of results, as shown in the following image.
-
Expand the tree to see the different results the program can display graphically on plan.
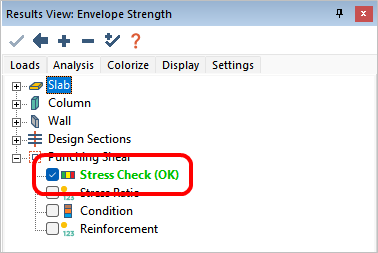
Note: You must select a strength combination or the strength envelope combination, for the Punching Shear results to become active.
-
Check the box next to the result you want to view.
The results are shown graphically on plan. The following image provides an example of the stress check result on plan.
Click on image to enlarge it
The following table provides descriptions of the available graphical results.
 Available Graphical Results - table
|
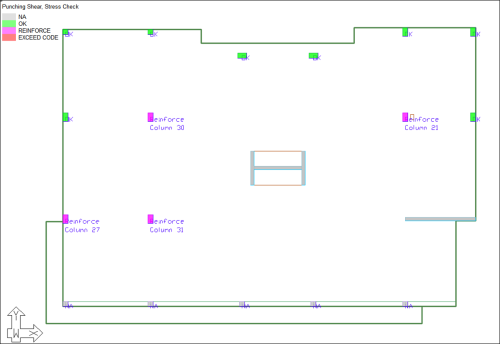
Stress Check
|
When Stress Check is selected, the following design outcomes for the selected load combination are displayed:
-
OK - Calculated stresses are below allowable stresses.
-
Reinforce - Calculated stresses exceed allowable stresses and design code requires reinforcement.
-
Exceeds Code - Design code requirements are not satisfied.
-
NA- Punching shear design is not applicable.
An example of the stress check result shown on plan can be viewed in the following image.
Click on image to enlarge it
|
|
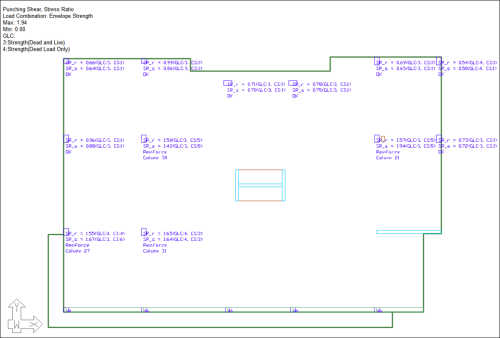
Stress Ratio
|
When Stress Ratio is selected, the punching shear stress ratios for the selected load combination will display on the screen. In addition, the controlling load combination and critical section for each column is denoted on screen.
The maximum and minimum ratios are also reported in the results legend at the top left of the modeling window.
An example of the stress ratio result shown on plan can be viewed in the following image.
Click on image to enlarge it
|
|
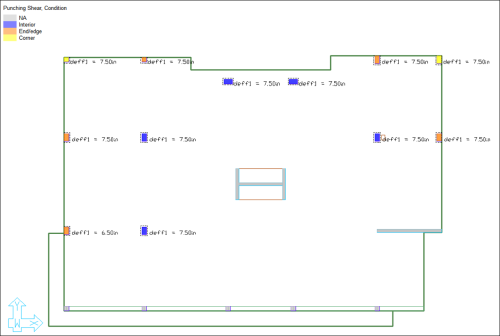
Condition
|
When Condition is selected, the columns' position and designation for shear check, as well as the first critical section at the face of the column and drop cap/slab thickening, is displayed.
In addition, deff for the critical section is reported.
An example of the column condition result shown on plan can be viewed in the following image.
Click on image to enlarge it
|
|
Reinforcement
|
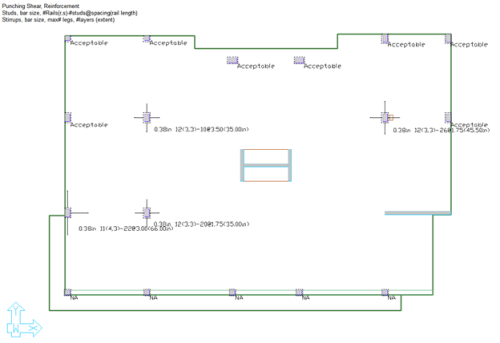
When Reinforcement is selected, the program displays a graphical representation of the shear reinforcement to scale on plan.
The legend for the text is also shown in the upper left of the modeling window.
An example of the reinforcement result shown on plan can be viewed in the following image.
Click on image to enlarge it
|
View Punching Shear Tabular Results
To view tabular punching shear results:
-
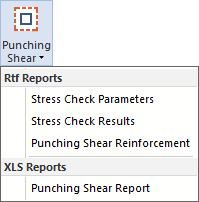
Go to the Reports ribbon.
-
Click on Punching Shear, to expand the list of available reports.
-
Click on the report you want to generate.
The program creates the report and displays it on screen.
-
RTF reports are opened in the default word processor (Microsoft Word, Notepad, etc.).
-
XLS reports are opened in the default spreadsheet program (Microsoft Excel, OpenOffice, etc.) on the computer.
Note: The XLS Punching Shear Report details the results for each layer checked at each individual column. It is the most comprehensive of the reports.
Interpret Punching Shear Reinforcement Tabular Output
ADAPT-Builder reports punching shear reinforcement differently, depending on whether the reinforcement used is set to Stud or Stirrup.
Reinforcement Type: Stud
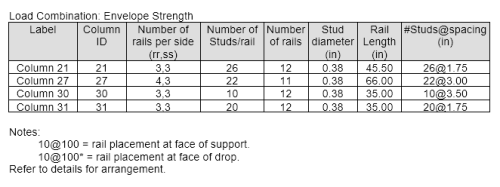
When the reinforcement type is set to stud, the Punching Shear Reinforcement report is shown similar to the example in the following image. Note that the image only shows the Envelope condition, in practice the report shows the same information for each strength combination in the model.
Click on image to enlarge it
The reinforcement metrics reported in the table above reads as follows when the reinforcement type is set to stud.
-
For Column 30, we have three stud rails specified per support side.
-
Each rail has 10 studs.
-
The distance to the first stud of each rail from the face of support is 3.50 inches and the spacing between subsequent layers is 3.50 inches.
-
The stud diameter is 0.38”.
-
The rail length is 35".
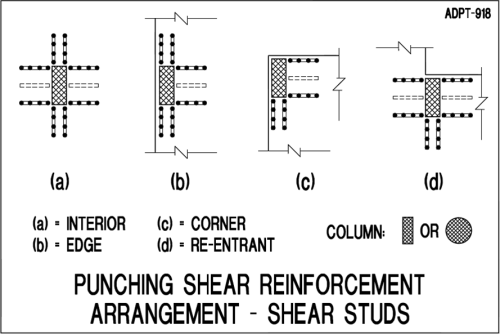
Arrangement of punching shear stud reinforcement at different column conditions is shown in the following image.
Click on image to enlarge it
Reinforcement Type: Stirrup
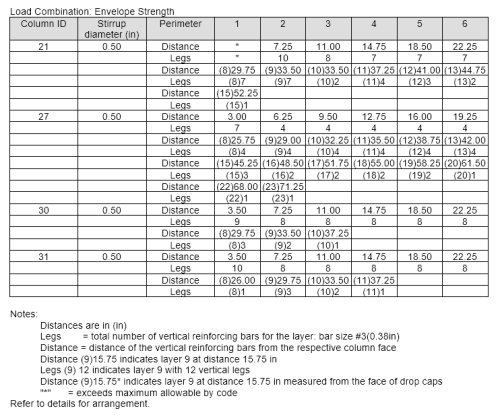
When the reinforcement type is set to stirrup, the Punching Shear Reinforcement report is shown similar to the example in the following image. Note that the image only shows the Envelope condition, in practice the report shows the same information for each strength combination in the model.
Click on image to enlarge it
The reinforcement metrics reported in the table reads as follows when the reinforcement type is set to stirrup.
-
For Column 30 we have 9 legs at a distance of 3.50 inches from the face of column, followed by 8 legs at a distance of 7.25 inches from the face of the column.
-
The 9 and 8 legs are the total number around the perimeter of the column.
-
Stirrup diameter is 0.5” (#4).
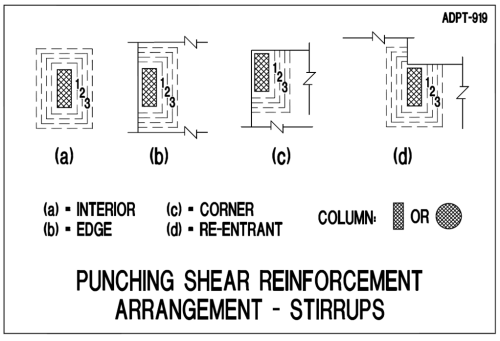
Arrangement of punching shear stirrup reinforcement at different column conditions is shown in the following image.
Click on image to enlarge it


