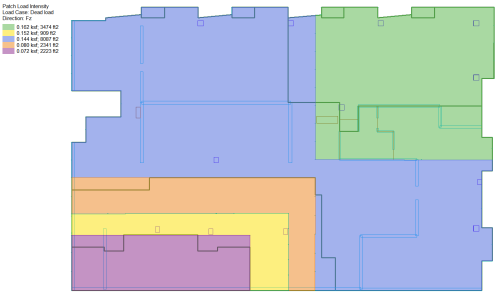
ADAPT-Builder includes options to Colorize Loads for easy visualization of loads and their magnitude. You have the ability to colorize point, line, and patch loads based on their magnitudes. Patch and line loads will be given a unique color per load magnitude. Point loads will have a color to represent a range of magnitudes for ease of display. Additionally, for area loads, you can display an intensity map of the load which will display the magnitude of the total load in a given area with a unique color. This provides an easy way to see the total magnitude in locations where area loads overlap due to the additive nature of loads within ADAPT-Builder. You also have the ability to include colorized load plans in the compiled report.

|
|
|---|---|
| Example of Area loads colorized by Magnitude | Example of Area load Intensity Map |
Click on image to enlarge
The options to colorize loads can be found in the Colorize panel.
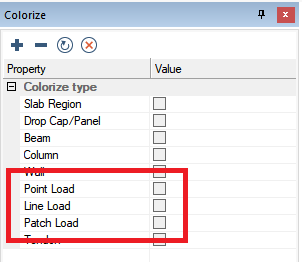
ADAPT-Builder provides two options for colorizing patch (area) loads. You may colorize loads based on their magnitude and colorize based on the load Intensity for Individual Load Cases. The intensity option will show the area load shaded based on the total applied load in a given location.
Using the magnitude option, the program will color each load with a unique color based on the input magnitude of the load.
To colorize patch (area) loads based on magnitude:
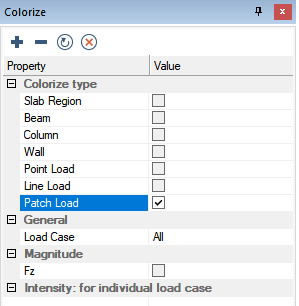
In the Colorize Grid check the box next to Patch Load.
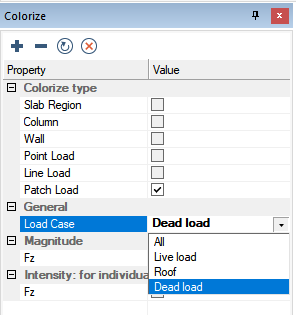
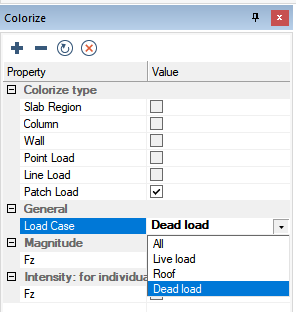
In the General section choose the Load Case you want to view area loads for from the drop-down list. In the below example we have chosen Dead load.
Check the load direction that you want to colorize the magnitude for, in the Magnitude section of the Colorize Grid. The options are Fz, Fx, Fy, Mx, and My. In this example, loads are only applied in the Fz direction; therefore, this is the only direction available to choose.
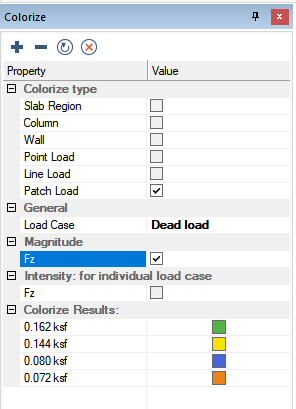
The program will then display on plan the applied load, with a color-coded outline based on the load magnitude.
Click on image to enlarge
The user can click on one of the Color/Magnitude entries in the Colorize Results section of the Colorize Grid to select the loads by magnitude.
Click on image to enlarge
In the legend, the program will show the load magnitude and its associated color.
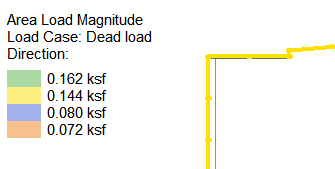
As loads in ADAPT-Builder are additive, the program includes an option for you to colorize and display the total magnitude of applied loads for an individual load case. Using the Intensity for Individual Load Cases option, the program will provide a unique color for loads based on the total load applied (resultant load) in a location.
To colorize patch (area) loads based on load intensity:
In the Colorize Grid check the box next to Patch Load.
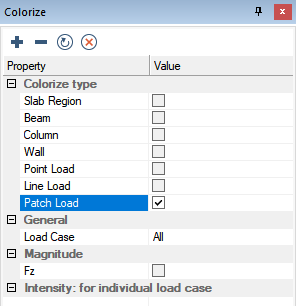
In the General section choose the Load Case you want to view the total area load for from the drop-down list. In the below example we have chosen Dead load.
In the Intensity: for individual load case section of the Colorize Grid, check the box for the load direction that you want to colorize the magnitude for. The options are Fz, Fx, Fy, Mx, and My. In this example loads are only applied in the Fz direction therefore this is the only direction available to choose.
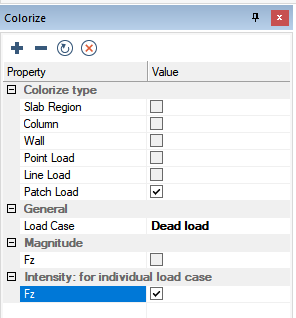
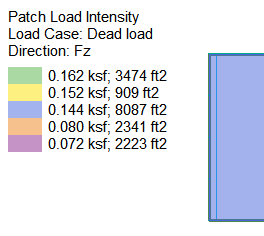
The program will then display the total applied load on plan, with a color-coded shading based on the total load applied in each shaded area.
Click on image to enlarge
In the legend, the program will show the load magnitude, the total area the load covers, and its associated color. .
ADAPT-Builder provides the user the option to colorize point loads based on their magnitude. When colorizing point loads the program will specify a color range for point loads. The program will then color the point loads based on the color range they fall into.
To colorize point loads based on magnitude:
In the Colorize Grid check the box next to Point Load.
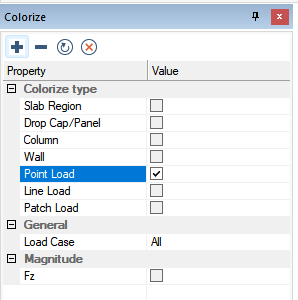
In the General section choose the Load Case you want to view point loads for from the drop-down list. In the below example we have chosen the EQX load case.
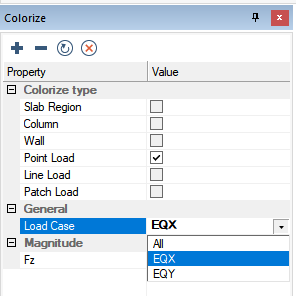
In the Magnitude section of the Colorize Grid, check the box for the load direction that you want to colorize the magnitude for. The options are Fz, Fx, Fy, Mx, and My. In this example loads are only applied in the Fz direction; therefore, this is the only direction available to choose.
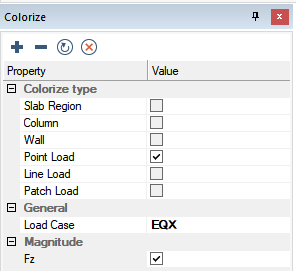
The program will then display the point loads on plan, color-coded based on the magnitude range the load falls into.
Click on image to enlarge
In the legend the program will show the load magnitude range and its associated color. For example, the cyan color below represents loads between 0 kips and 9.999 kips in magnitude.
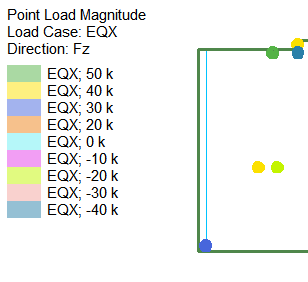
The user can click on a load magnitude in the Colorize Results section of the Colorize Grid to select the loads with that magnitude.
Click on image to enlarge
ADAPT-Builder provides the user the option to colorize line loads based on their magnitude.
To colorize line loads based on magnitude:
In the Colorize Grid check the box next to Line Load.
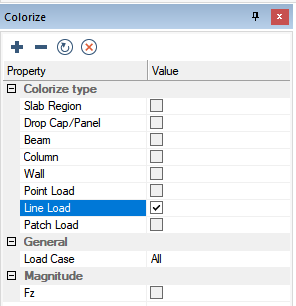
In the General section choose the Load Case you want to view line loads for from the drop-down list. In the below example we have chosen Dead Load.
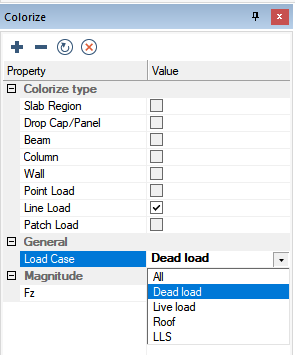
In the Magnitude section of the Colorize Grid, check the box for the load direction that you want to colorize the magnitude for. The options are Fz, Fx, Fy, Mx, and My. In this example loads are only applied in the Fz direction therefore this is the only direction available to choose.
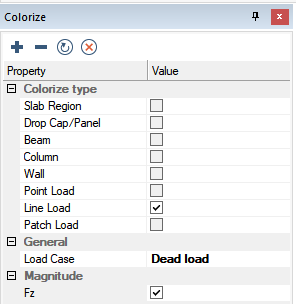
The program will then display the line loads on plan, color-coded based on the magnitude of the applied load.
Click on image to enlarge
In the legend the program will show the load magnitude and its associated color.
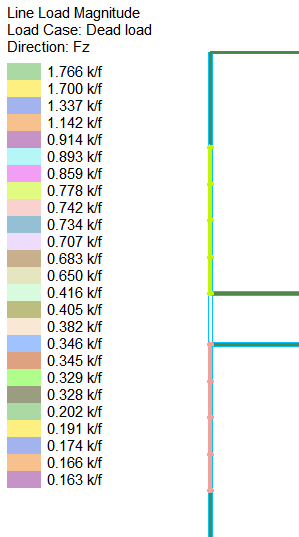
The user can click on a load magnitude in the Colorize Results section of the Colorize Grid to select the loads with that magnitude.
Click on image to enlarge
The program gives you the option to include the colorized loading plans in the compiled report.
To include colorized load plans in the compiled report:
In the Colorize Grid select the options to colorize the load plan you want to include in the report. In this example we have chosen to include the area load intensity map for the Dead Load case.
Click on image to enlarge
Go to Reports>Compiled Reports and click on the Take Report Screenshot ![]() icon.
icon.
In the Report Name dialog window enter the name you want for the screenshot using your keyboard.
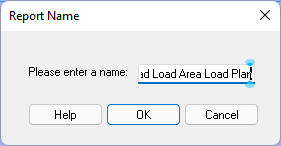
Click on OK to close the window and save the report screenshot.
Go to Reports>Compiled Reports and click on the Open Report Compiler ![]() icon to open the Report Generation Manager dialog window.
icon to open the Report Generation Manager dialog window.
Click on image to enlarge
Expand the Graphical>Screenshots trees and select the screenshots you want included in the report. The screen shot title will now be visible in the right-hand pane indicating that it will be included in the report.
Click on image to enlarge
Go to File>Generate Compiled Report and choose to create the RTF Report or the PDF Graphical Report.
Click on image to enlarge
The program will open the RTF or PDF report in your word processor or pdf viewer.
Click on image to enlarge