Printing
You may print graphics as they appear on the screen or print all (or
part) of the tabulated model information. If a spreadsheet is currently active
and you click the print  button the following options are presented.
If a model view is currently active, and you select the print button,
Graphic
Print Options are presented.
button the following options are presented.
If a model view is currently active, and you select the print button,
Graphic
Print Options are presented.
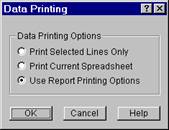
If you have lines selected in the spreadsheet then you may print only
those lines by selecting the first option. If you wish to print
the entire spreadsheet you may choose the second option. The last
option allows you to print multiple spreadsheets in a custom report that
is discussed in the next section. You may combine the last two options
with the Exclude feature to hide some data and print only the data you
want.
- While in a spreadsheet
click on the Print button and
choose to print the current spreadsheet, a selected portion of the spreadsheet,
or multiple sections by printing a report. If you are in a model
view the Graphic Print Options are opened so click 'Print a Report Instead'.
- While in a model
view click on the Print button
and choose from the options.
- If you are not in
a model view the Data Printing settings are opened instead. Close
this and click on the model view that you want to print before clicking
the Print button.
Printing Reports
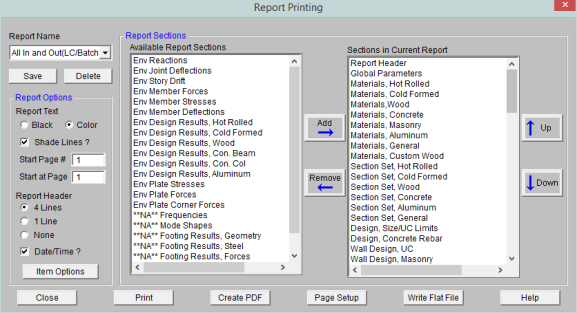
The Report Printing Dialog options help you build your reports. There
are standard reports for you to choose from and you may also name and
save any report format you custom build. To choose a standard report,
simply pick it from the Report Name drop down list.
Building a Report
To build your own custom report you may double-click on report sections
in order to move them from the available sections on the left,
to the report defined on the right. You may
use the mouse and the SHIFT or CTRL keys to pick multiple sections and
then move them with the Add button. You can re-order the report by dragging and dropping the sections in your report you would like to movewith the Up and Down buttons and remove sections with the Remove button.
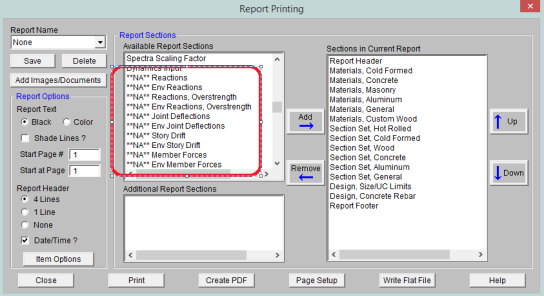
The Sections in Current Report portion of the dialog shows which sections and the order the printed report will be built. Report sections can come from either the Available Report Sections or the Additional Report Sections. The Available Report Sections contains every input and output spreadsheet in the program. The Additional Report Sections contains all images that were added to the project. Images can be added either using the "Snapshot" option or by adding external images using the Add Images/Documents button.
- Any saved reports from the Report Names drop-down will currently only save spreadsheet information. Any snapshots or images will manually need to be added to any saved reports.
- The program will flag solution spreadsheets as to whether there is information available in them. If that type of solution has not been run you will see a prefix of **NA** ahead of that spreadsheet in the Available Report Sections.
Report Options
Formatting options allow you to specify many options:
Report Text - Allows you to define the text color as black or blue.
Shade Lines? - Allows you to shade every other line to enhance readability.
Start Page # - Allows you select the starting
page number. The number shown will be the next page number in the
current sequence, but you can override this for occasions where you need
to insert your calculation pages into an existing report and you need
the page numbering to match.
Start at Page - Allows you to start your numbering at some page other than page one. This can be helpful if you have a title page or table of contents that you don't want to number.
Report
Header - All reports have a footer with version
information, the file name and path, and the page number. The single
line header option will include the Model Title specified in the Model Settings along with the date. The triple line header adds
company, designer, job number, and a place
to initial any checking to the header.
Date/Time? - Allows you to turn off the
Date/Time stamp so that this will not appear
on your printed reports.
Item Options - Allows you to select member related options. You may specify that you want the member
results to be listed for each member section (specified in the Model Settings) or just for the member ends, which can be useful for connection
design.
- See the Customizing RISA-2D topic for more information about printing, including the ability to print out a RISA or custom company logo.
Printing to a File
A flat file is
a file without column headings, print formatting, or graphical elements
and is useful for importing and parsing into spreadsheets, database tables,
or as post processor input data.
There are several options available to make the flat file easier to
parse. Note that printing and then looking at a sample output file
with all the options selected will make it easier to understand what the
options do.
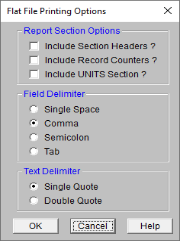
You have an option to include the 'Section Headers' which will print a
text description of each block of data. For example, the Joint Coordinates
data would be preceded by a [JOINT COORDINATES] header on it’s own line
before the data. You may also include a 'Record Count' which is useful
if you’re writing looping code to read in the number of records within
each data block. The number of records prints on it’s own line. You can also have a special 'UNITS Section' be printed out which will give
you the units used for all the values in the program.
The field delimiter options let you choose what character will be used
to separate each field of data within record. For example, each
coordinate value in the Joint Coordinates data would be separated by the
character selected. Programs that you might be importing the file
into like MS Excel or MS Access often have options to select what the
field delimiter will be for records of data.
The text delimiter works like the field delimiter, except that it’s
used to set apart text labels. All text in the flat file will be
enclosed at the beginning and the end by the selected text delimiter character.
This is very useful when trying to read in label strings that contain
embedded spaces. As an example, the Joint labels in the Joint Coordinates
data would each be enclosed by a single or double quote.
The current flat file options are saved each time the program is closed.
- While in the a spreadsheet
click on the Print button, Choose
Use Report Printing Options and click OK, then choose Write
Flat File.
Graphics Printing
Many of the same options that exist in Report Printing are present in Graphic Printing, but some unique options available are Scale Factors and Title Block Info.
These options control the graphics printing. You may choose to
print in Portrait or Landscape mode.
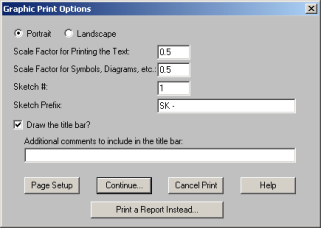
Next, two Scale Factors are defined.
These scale
factors are used to make the text and symbols displayed as part of the
graphic, larger or smaller. A
higher scale factor makes the text or symbol bigger. Since
the resolution of the printer is probably much greater than the resolution
of your screen, you can probably make the text and symbols smaller (by
using a scale factor of less than 1.) than they appear on screen and they
will still be easily readable. This
makes for a cleaner looking graphic print. As
far as what scale factors you should use, the only way to be sure is to
experiment a little.
You may include the Title Bar to display the Model Title, Designer, Company Name, Date and Time (All of which are defined in your Project Info). You can also
enter a comment that will be included in the Title Bar. Page Setup
allows you to set the margins.
You can specify a Sketch # and a Sketch Prefix to label your graphic prints as well.
Once you have everything the way you want it choose Continue.
This will bring you to the print settings that are specific to your printer.
The choices are different for each printer but generally allow you to
choose the printer, orientation, quality and quantity.
The bottom button Print a Report Instead
is provided so you can get to the report printing dialog directly from
a graphic view.