General
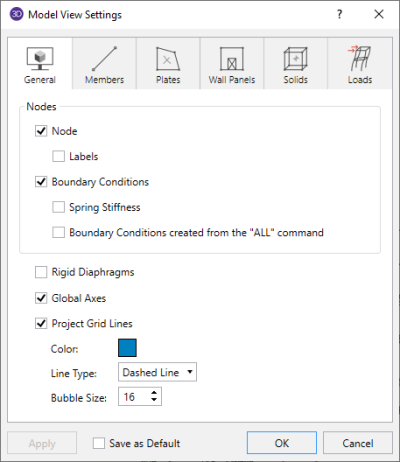
Access the graphical options for nodes by clicking the Model icon in the View Settings section of the View ribbon and selecting the General tab shown below.
Click on image to enlarge it
You can specify that Nodes are/ are not displayed, and you can include the joint label.
You can display Boundary Conditions and as part of this option you can display any spring stiffnesses that you have specified. The “ALL” boundary condition is not shown unless it is also specified.
Rigid Diaphragms are plotted if its box is checked.
You can indicate whether the global axes icon is to be displayed in the upper left corner of the model view by checking the Global Axes box.
Checking the Project Grid Lines box turns on the display of the project grid in the current model view. The color and line type for the grid can also be customized. Click the colored rectangle to choose a custom color. Choose from the Line Type drop down to display the project grid with dashed or solid lines. The Bubble Size drop down list allows you to choose a font size for the grid labels and the bubbles that encompass them.
