Diaphragms
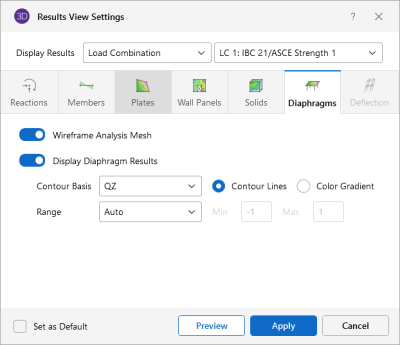
Access the graphical Results View Settings for Semi-Rigid Diaphragms for models integrating from RISAFloor by clicking the Results icon in the View Settings section of the View ribbon and selecting the Diaphragms tab shown below.
Click on image to enlarge it
The Draw Diaphragms As...section of this tab lets you specify that solids are to be drawn as wireframe, contour, or that they are not to be shown at all.
When the Wireframe option is selected, you can include the contours or the FEA plate submesh after a single or batch solution has been performed. The display of line contours represents the force or stress results for the internal plates. Each color line represents a specific value. For batch solutions, you must choose which load combination you want to view in the Combination To Use For Results Display drop down list.
The Contours are plotted with a global smoothing algorithm that allows the contour to vary across the internal plate elements. The contours are drawn as color filled areas.
The Contouring Control section determines what force or stress result is to be contoured and how the contour colors are to be assigned. The Value drop down list is where you select the specific result to be contoured (QX, QY, MX, MY, etc.). Note that the forces are based on the global axis as indicated with a capital axis letter (MX vs Mx). The Range controls determine how the contour colors are assigned. You can either contour the full range of the results by choosing Calculated Maximum to Minimum, or, if you are only interested in a specific range of values, you can choose User Defined and enter your own max and min values.
