Solids
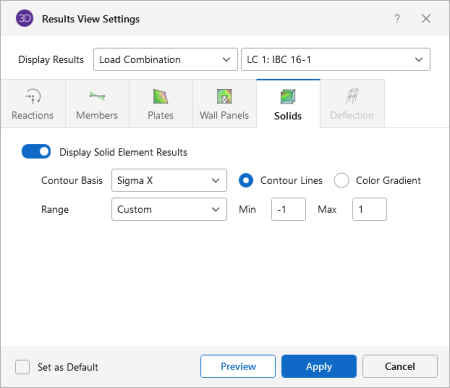
Access the graphical Results View Settings for solids by clicking the Results icon in the View Settings section of the View ribbon and selecting the Solids tab (as shown in the following image).
Click on image to enlarge it
Click on the Display Solid Element Results slider to make it turn gray, if you don’t want to display any solid element results.
The Contour Basis drop down list is where you select the specific result to be contoured (SigmaX, Y or Z, Sigma1, 2 or 3, Von Mises, etc.). The Range controls determine how the contour colors are assigned. You can either contour the full range of the results by choosing Automatic, or, if you are only interested in a specific range of values, you can choose Custom and enter your own max and min values.
If a single or batch solution has been performed, you can display contour lines representing the force or stress results for the solids. Each color line represents a specific value. For batch solutions, you must choose which load combination you want to view at the top of the Results View Settings dialog.
The Color Contours are plotted with a global smoothing algorithm that allows the contour to vary across the solid elements. Because of this, the plotted contour results will differ slightly from the tabulated results in the spreadsheets. This effect will be heightened in regions of a high rate of change such as applied loads or boundary conditions. The contours may be drawn as either lines or as color filled areas.
