Wall Panels
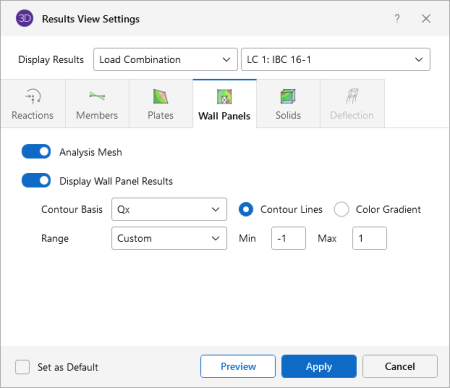
Access the graphical Results View Settings for panels by clicking the Results icon in the View Settings section of the View ribbon and then clicking the Wall Panels tab (as shown in the following image).
Click on image to enlarge it
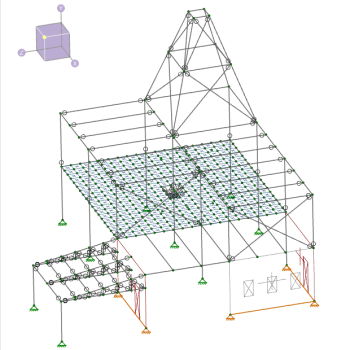
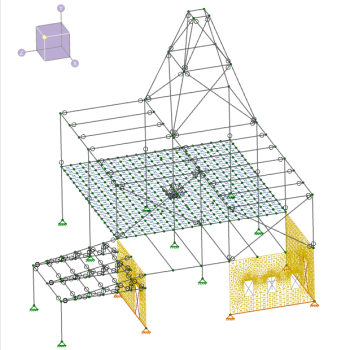
Click on the Analysis Mesh slider to turn this option on, if you want to view the internal mesh the program creates of the wall panel in order to perform the analysis. The following images show the analysis mesh turned off and on, respectively.
Click on the Display Wall Panel Results slider to turn this option on, if you want display any wall panel results.
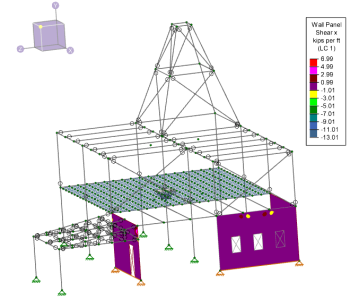
If a single or batch solution has been performed, you can display contour lines representing the force or stress results for the panels. Each color line represents a specific value. You also have the option to plot the stress and force results using filled color contours where each fill color represents a range of values. The wall panels are plotted with different colors that are mapped in a key shown in the upper right corner of the model view. For batch solutions you must choose which load combination you want to view at the top of the Results View Settings dialog.
-
The Contour Basis drop down list is where you select the specific result to be contoured (Qx, Fx, Mx, Von Mises, etc.). The Range controls determine how the contour colors are assigned. You can either contour the full range of the results by choosing Automatic, or, if you are only interested in a specific range of values, you can choose Custom and enter your own max and min values.
-
The Color Contours are plotted with a global smoothing algorithm that allows the contour to vary across the panels. Because of this, the plotted contour results differ slightly from the tabulated results in the spreadsheets. This effect is heightened in regions of a high rate of change such as loads or boundaries. The contours can be drawn as either lines or as color filled areas.
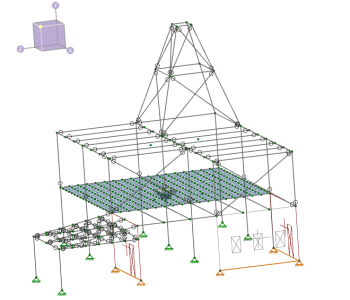
The following examples show the Display Wall Panel Results option turned off and on respectively, for the QX Contour Basis with the Color Gradient option also chosen.
