Piles/Pile Caps
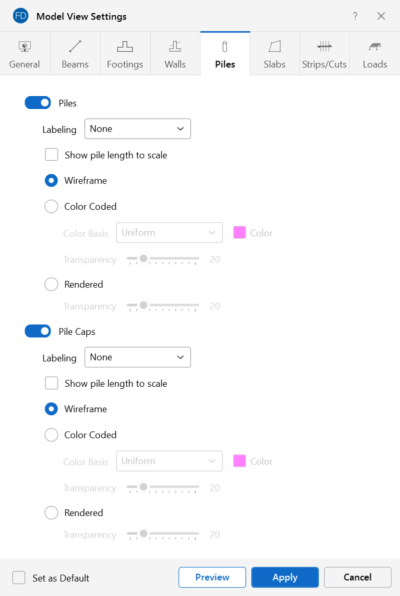
Access the graphical Model View Settings for piles and pile caps by clicking the Model icon in the View Settings section of the View ribbon and selecting the Piles tab shown below.
Click on image to enlarge it
You can specify that no piles or pile caps are displayed, or you can show them with a Label, Color Code or Rendered.
Click on the Piles or Pile Caps sliders to not display the piles or pile caps in the model at all. The Labeling drop-down list provides the choices you have as to what information displays alongside each pile or pile cap. Options include: None, Label and Local Axes.
Select the Show pile length to scale check box to display the overall pile length true-to-scale. When this box is unchecked, the displayed length of pile elements is truncated.
When the Wireframe option is selected, you can include textual information on the piles when plotted.
When the Color Coded option is selected, piles and pile caps are plotted with different colors that are mapped in a key shown in the upper-right corner of the model view. You can color the piles or pile caps by material set, or specify a uniform color. The color-coded piles or pile caps may be presented with varying Transparency, with 100% transparency meaning completely see through, and 0% indicating completely solid. The transparency is controlled by clicking and dragging the slider bar until the desired percentage is displayed at the end of the bar.
The Rendered option produces true-to-scale renderings of the piles and pile caps. The Transparency setting described above for the Color Coded option also applies for the Rendered option.
