Footings
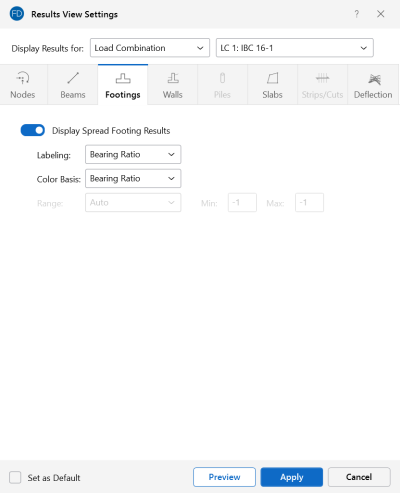
Access the graphical Results View Settings for spread footings by clicking the Results icon in the View Settings section of the View ribbon and selecting the Footings tab.
Click on image to enlarge it
Clicking the Display Spread Footing Results slider (to make it turn blue) will display Spread Footing Results in the model view.
You can specify that spread footing results are to be shown with labels, or using a color basis.
The Labeling drop-down list provides the choices you have as to what information will be displayed alongside each spread footing.
Choosing a Color Basis for spread footing results uses various colors to represent particular results, such as the unity check, stress levels, etc. The drop-down list provides the choices you have as to how the colors are to be assigned to each spread footing. You may color the spread footings by the code check or the stress magnitudes. The key that defines these colors is shown in the upper-right corner of the model view.
The Range controls determine how the contour colors are assigned. You can either contour the full range of the results by choosing Automatic, or, if you are only interested in a specific range of values, you can choose Custom and enter your own Min and Max values.
For additional advice on this topic, please see the RISA Tips & Tricks webpage at risa.com/post/support. Type in Search keywords: Graphics.
