Drift and Moment Amplification Factors
With the P-Delta feature, ADAPT-Builder graphically reports Drift Amplification Factors and Moment Amplification Factors (2nd/1st order results) for local axes (RR and SS) as well as the combined global results. The program code checks against a user-defined value set in the Result View panel as outlined below.
Some design codes require an explicit limitation on drift amplification for the purpose of ensuring a stability limit. The following sections describe how the drift and moment amplification factors (DAF and MAF) are used. The prerequisite to these results is to have completed a Multi-Level Analysis with the presence of P-Delta combinations included.
Graphical Drift Amplification
To display the graphical drift amplification values and code check:
-
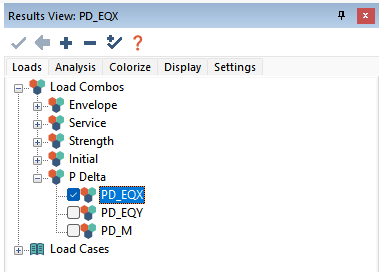
Go to the Results View panel and click on the Loads tab.
-
Select a P-Delta combination result as shown below.
Note: Selection of the master P-Delta combination is usually not required or typical for drift amplification since it serves only as the driver for the geometric stiffness generation.
-
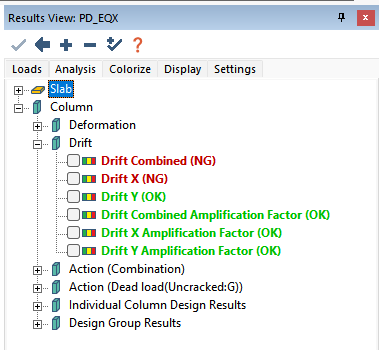
Click on the Analysis tab in the Results View panel.
-
Expand the Column tree and expand the Drift result tree. The different results available are shown below. The different results will be colored Green or Red to indicate if the result for the select combination passes the code check value (OK) or fails the code check value (NG).
-
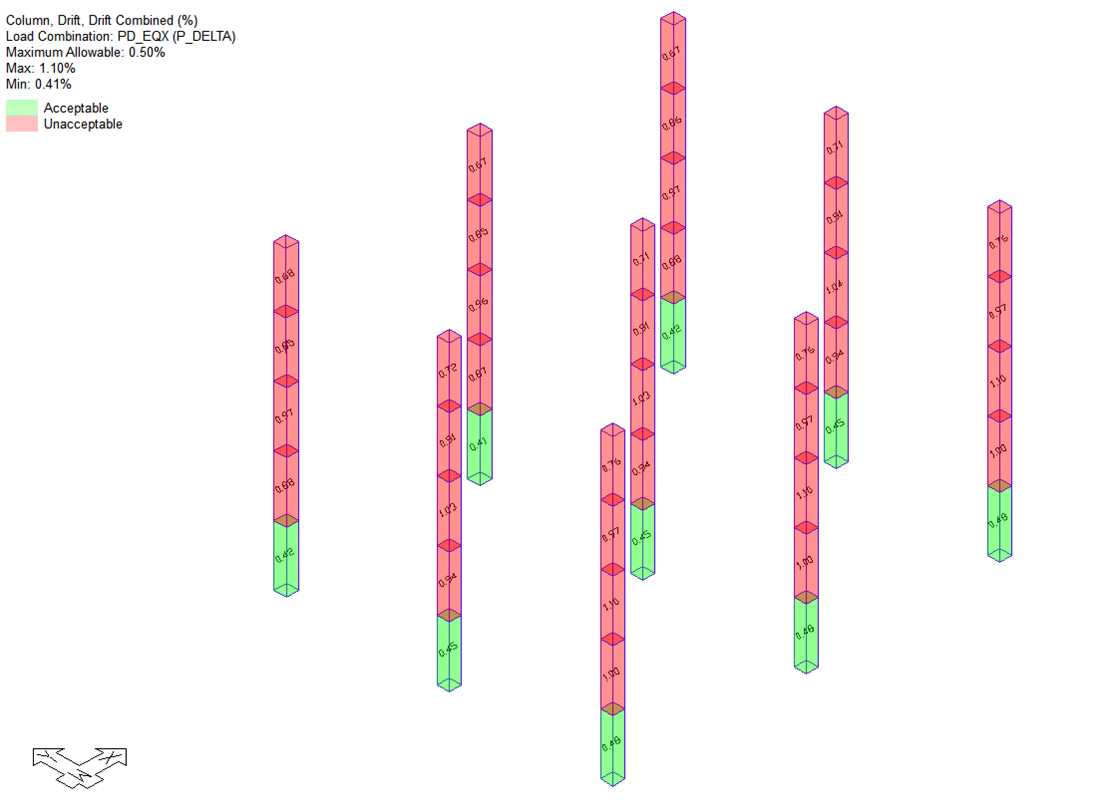
Click on the result you would like to display on screen. Note the legend in the upper corner of the window reports the result, combination and type, allowable value, and the max/min. values.
Click on image to enlarge
-
The program will produce a Green or Red colored column to indicate if the value is less than or greater/equal than value for max allowable drift amplification defined by you. The max allowable drift amplification factor value is set to 1.4 by default.
-
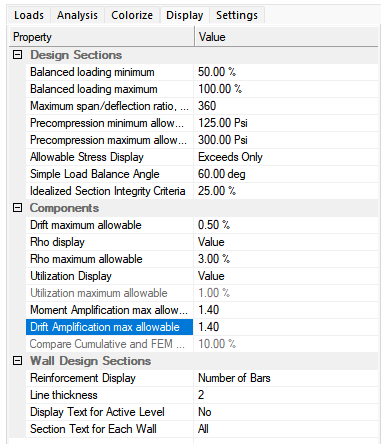
You can change this setting by clicking on the Display tab of the Results View panel. The input is highlighted in the image below.
-
Modify the input value and then click the blue check mark  icon at the top of the Results View panel to update the result based on the new limit
To produce this result, the program calculates the drift for both the 1st and 2nd order results. Drift is taken as the differential displacement from the top node of the upper frame element of the column to the bottom node of the bottom frame element of the column, divided by story height. The ratio is then taken between the calculated drifts for 2nd to 1st order results. Note that if a situation is modeled where multiple columns extend over multiple floors and don’t connect to slabs at each column break point, the drift is still reported per column and the height used is that between the top and bottom of column.
Displacements used for the drift calculations are those relative to the result selection made, X, Y or combined. For combined, the program uses the global displacements.
Graphical Moment Amplification
To invoke the moment amplification values and code check:
-
Go to the Results View panel and click on the Loads tab.
-
Select a P-Delta combination result as shown below.
Note: Selection of the master P-Delta combination is usually not required or typical for drift amplification since it serves only as the driver for the geometric stiffness generation.
-
Click on the Analysis tab in the Results View panel.
-
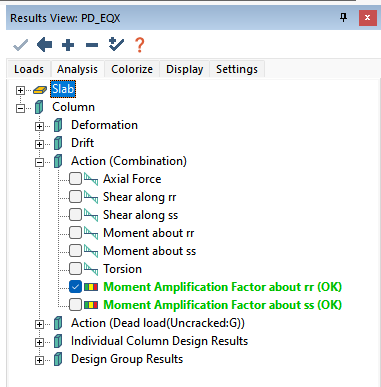
Expand the Column tree and expand the Action (Combination) result tree. The different results available are shown below. The different results will be colored Green or Red to indicate if the result for the select combination passes the code check value (OK) or fails the code check value (NG).
-
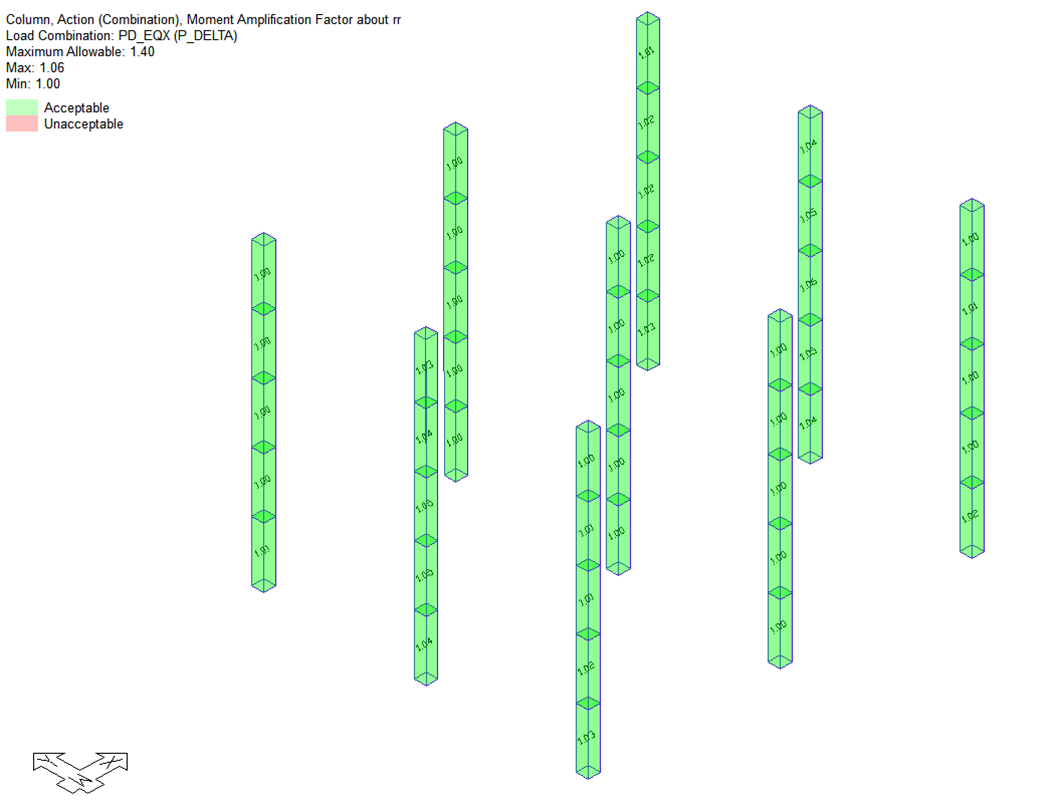
Click on the check box next to one of the Moment Amplification Factor results to display the result on screen. Note the legend in the upper corner of the window reports the result, combination and type, allowable value, and the max/min values.
Click on image to enlarge
-
The program will produce a Green or Red colored column to indicate if the value is less than or greater/equal than the value for max allowable moment amplification defined by you. The max allowable moment amplification factor value is set to 1.4 by default.
-
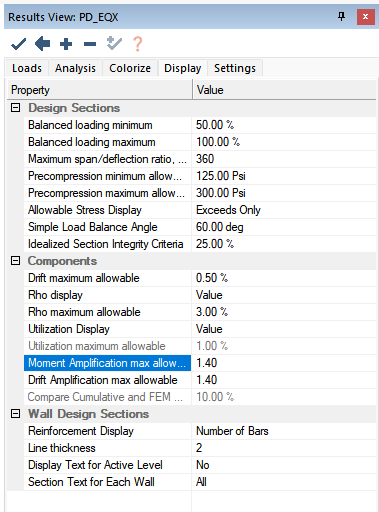
You can change this setting by clicking on the Display tab of the Results View panel. The input is highlighted in the image below.
-
Modify the input value and then click the blue check mark icon at the top of the Results View panel to update the result based on the new limit
To produce this result, the program calculates the moments at the top and bottom of columns for both the 1st and 2nd order results. The ratio is then calculated for the top and bottom locations for 2nd to 1st order results. The maximum ratio is reported and checked against the allowable.
In addition to Graphical Drft and Moment Amplifcation results, you have the ability to view the tabular XLS Drift Report.