Move to multi-level mode and run a Multi-Level Analysis with the P-Delta load combinations you created and included in the selection of load combinations.
Upon completion of the analysis, the Results View panel opens on the right side of the user-interface.
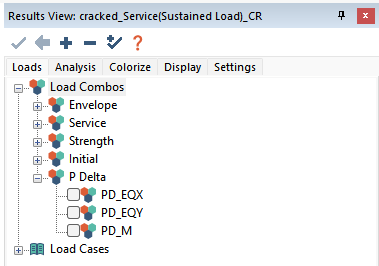
In the Loads tab of the Results View window, expand the Load Combos > P-Delta tree.

Select the P-Delta combination you wish to view the results for.
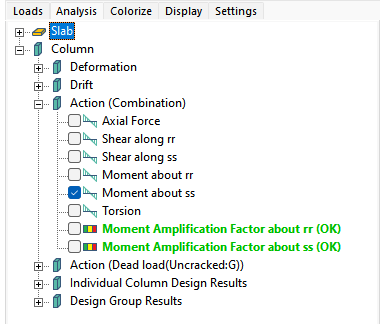
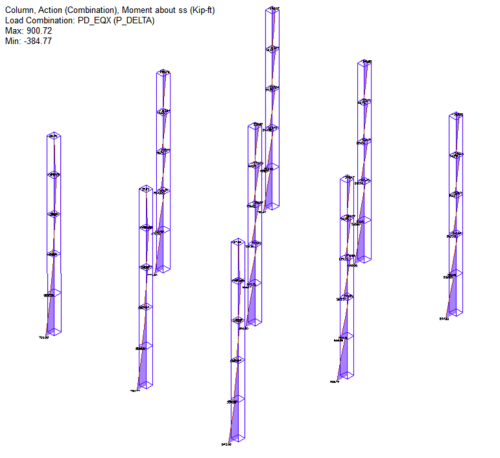
In the following example, it shows theColumn > Action (Combination) > Moment about ss.

Since this is a column result, go to the Column Design ribbon and click on the Columns Only _22x22.png) icon, to display only the columns in the model for easier viewing.
icon, to display only the columns in the model for easier viewing.
Move to an isometric view.
The display of the results on screen look similar to that shown in the following image.
Click on image to enlarge
Review other results in the same fashion using the Results View panel Analysis tab options.
Review results for other load combinations by choosing a different load combination in the Results View panel Loads tab.
