View Cracked Deflection Results
You can review the cracked deflection results using the Results View panel or through the ADViewer. In addition you can view the Reduced Rotational Stiffness contour plots as well.
To view cracked deflection results through the Results View panel:
-
After Performing a Cracked Deflection Analysis the Results View panel will open on the right side of the interface.
-
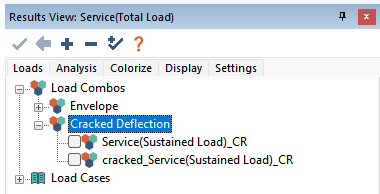
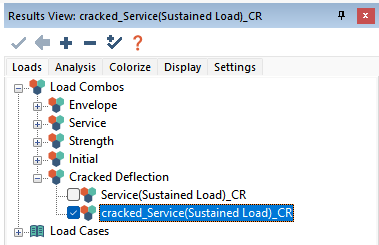
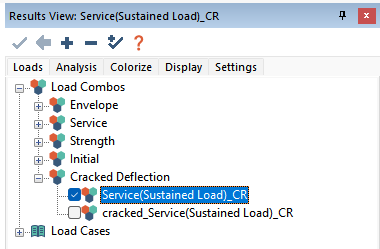
On the Loads tab expand the Cracked Deflection tree. The combination(s) you input, whose analysis/design option was set to cracked deflection, will be listed. Each user combination will have an accompanying cracked_ combination. The original named combination is for the uncracked state of the combination and the cracked_ prefixed combination will show the result of the combination considering the loss of stiffness due to cracking.
-
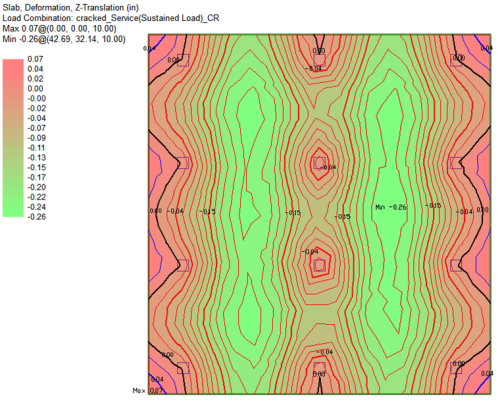
Select the combination prefixed with cracked_.
-
The deflection contour will be displayed on plan. An example is shown below.
Click image to enlarge
-
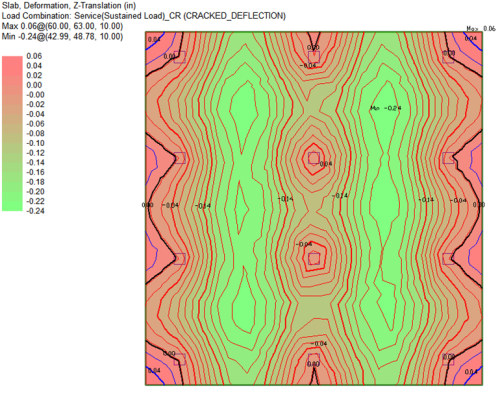
Select the original cracked deflection combination.
-
The uncracked state of deflection for the combination will display on plan.
Click image to enlarge
-
You can modify the display of results the same as Modifying the Display of Contour Results.
To view cracked deflection results through the ADViewer:
-
Perform a Cracked Deflection Analysis
-
Go to Analysis>Analysis and click on the View Analysis Results  icon to open the ADViewer.
-
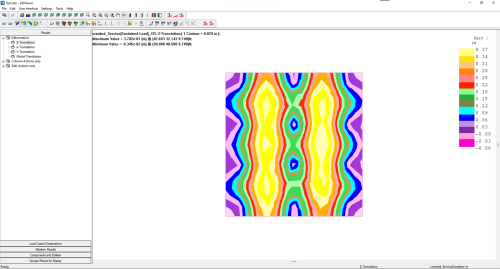
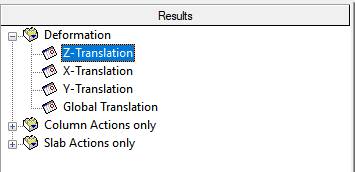
In the Results panel on the left, select the deflection result you want to view. In our example we will select the z-translation result.
-
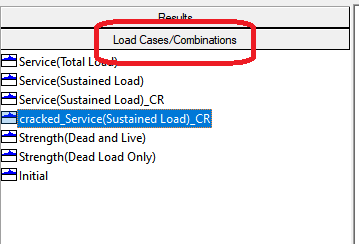
Click on the Load Cases/Combinations panel by default this is found at the bottom left of the ADViewer interface.
-
Select the cracked_ iteration of the load combination you would like to view.
-
Click on the Display Result  icon to display the result in the ADViewer.
Click image to enlarge
To view the reduced rotational stiffness contours of the ADViewer:
-
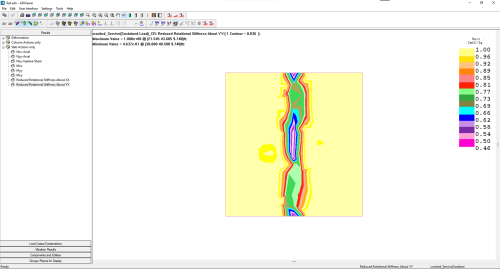
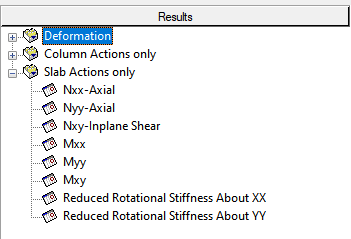
While still in the ADViewer click on the Results panel in the left windowpane and expand the Slab Actions Only tree.
-
Select the Reduced Rotational Stiffness About XX or YY result.
-
Click on the Display Result  icon to display the result in the result viewer. The loss of stiffness is represented as a ratio of effective to gross second moment of area.
Click image to enlarge
-
If the model includes beams, you can expand the Beam Actions Only tree, and select the Reduced Stiffness Ratio result for the beams as well.
-
The display of the results can be modified as outlined in the ADViewer topic of this help menu.


 icon to open the ADViewer.

 icon to display the result in the ADViewer.