View Graphical Analysis Results
The following section describes methods by which graphical analysis results can be viewed in the ADAPT-Builder main user interface (UI). You can review deflection results, contours, and so on directly in the main UI of ADAPT-Builder. Formerly, the ADViewer was exclusively used. When viewing results in the Results View panel in single-level mode the program will show results for only that level, when in multi-level mode the program will display the results for the full structure. In the ADViewer the results are displayed based on the last known analysis, when in multi-level mode the program will display the results for the full structure, and for single-level mode the last analyzed level results would be displayed.
In this section of the help menu we will go over how to use the Results View panel to Select the Result Units, View Analysis Results, View Load Case Reactions for Columns and Walls, Toggle Result Text Display, Font Height, and Scale, Modify Display of Contour Results and how to Show a 3D Render of a Contour Result. In addition we will learn how to use the ADViewer to View Analysis Results, Modify the Appearance of ADViewer Results, and Modify the Appearance of ADViewer Components.
View/Modify Graphical Analysis Results
The below items focus on specific result view tasks using the Results View panel. Refer to the Results View help topic for more detailed information on the options within the Results View panel.
To select the units for result display:
Before or after the display of Analysis Results, you can modify the units the results are displayed in by following the below procedure.
-
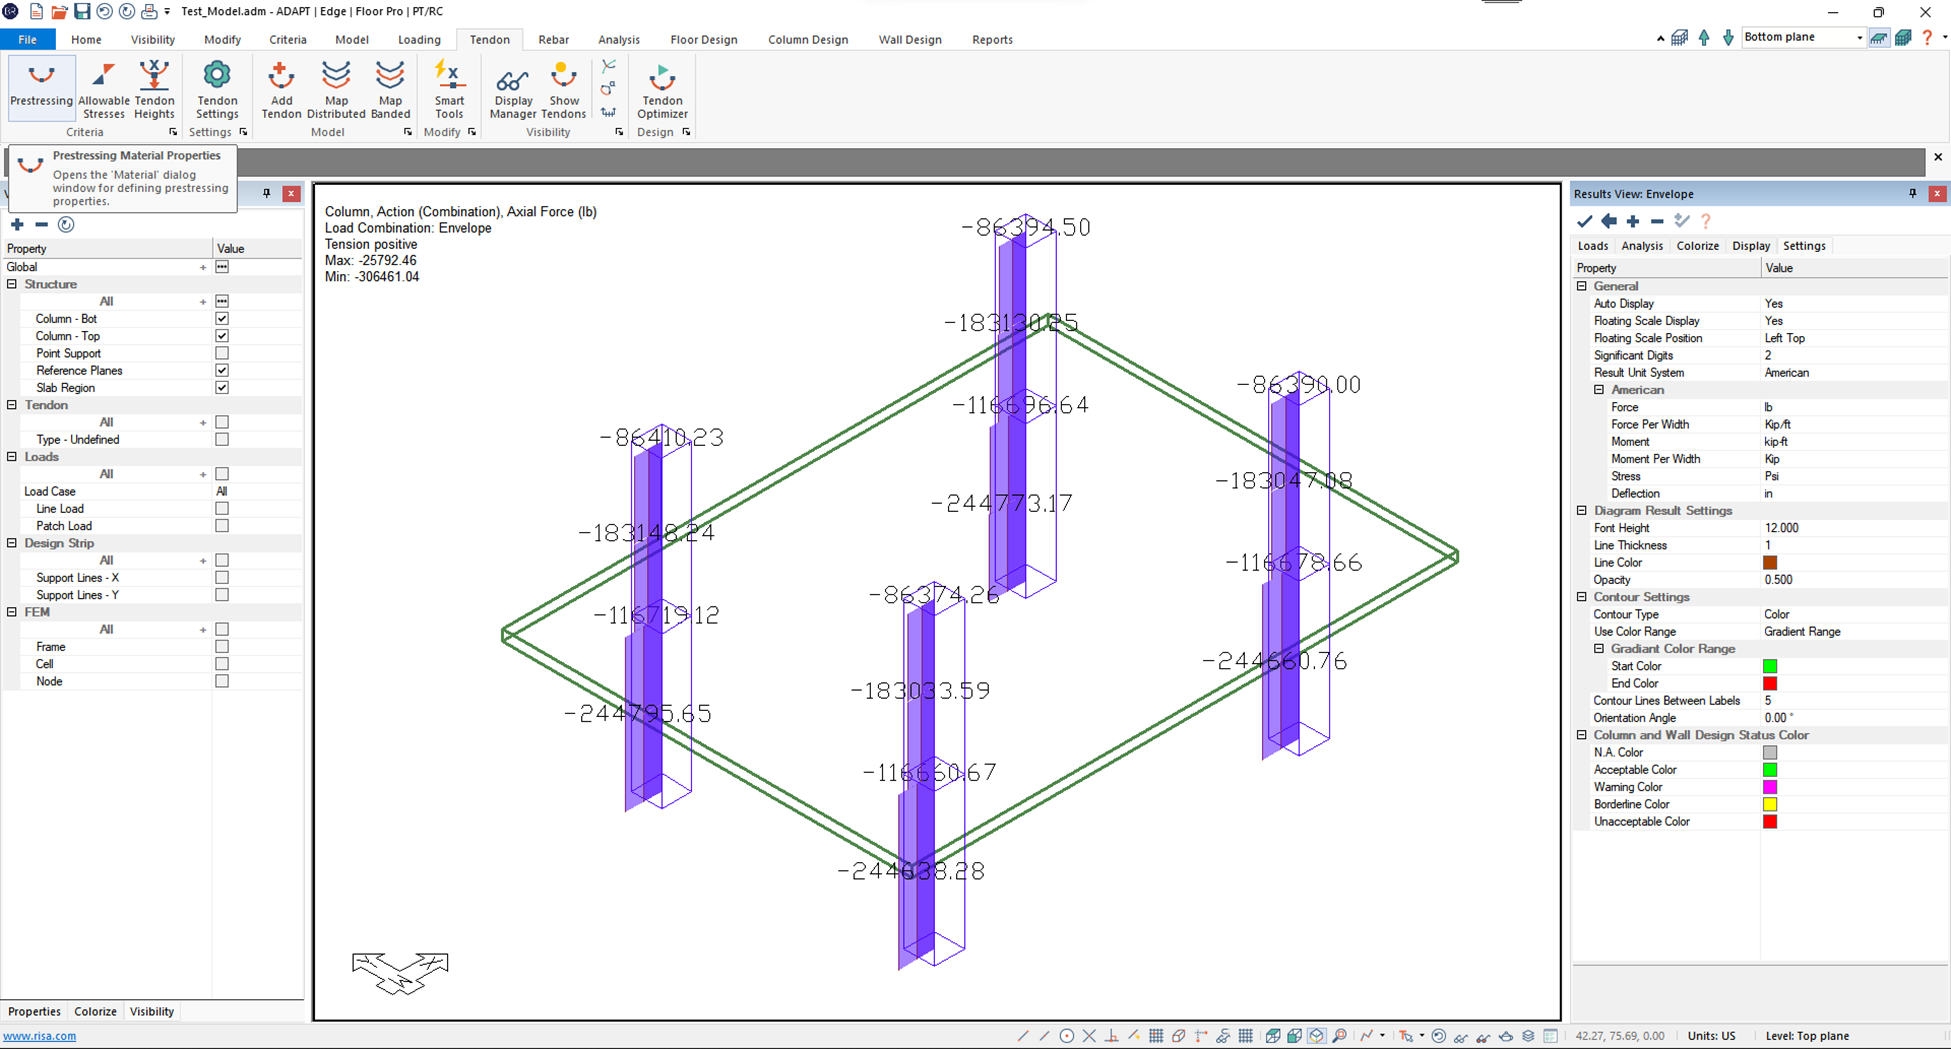
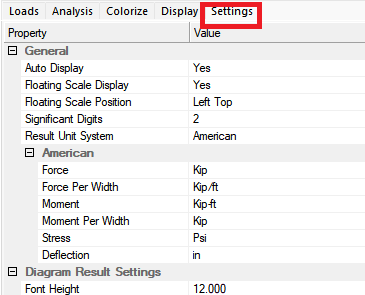
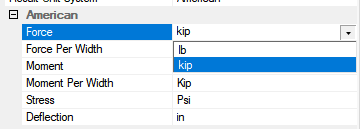
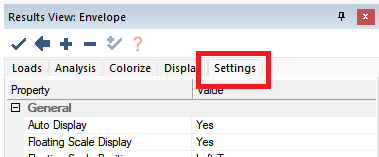
Click on the Settings tab of the Results View panel.
-
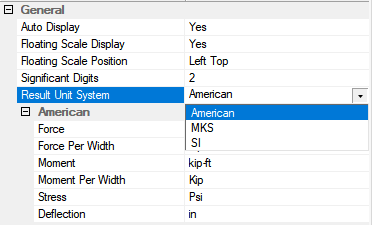
Click on the down caret in the Result Unit System Value column to expand the options available.
-
Click on the Value column of the action you want to change the unit for to bring up the available units for selection.
-
Select the unit you want to display the result in.
-
Click on the blue check mark icon at the top of the Results View panel. The results on plan will update to be based on the new unit selection.
Click image to enlarge
To view analysis results:
-
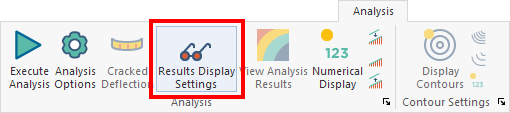
Go to Analysis>Analysis and click on the Results Display  icon to open the Results View panel
-
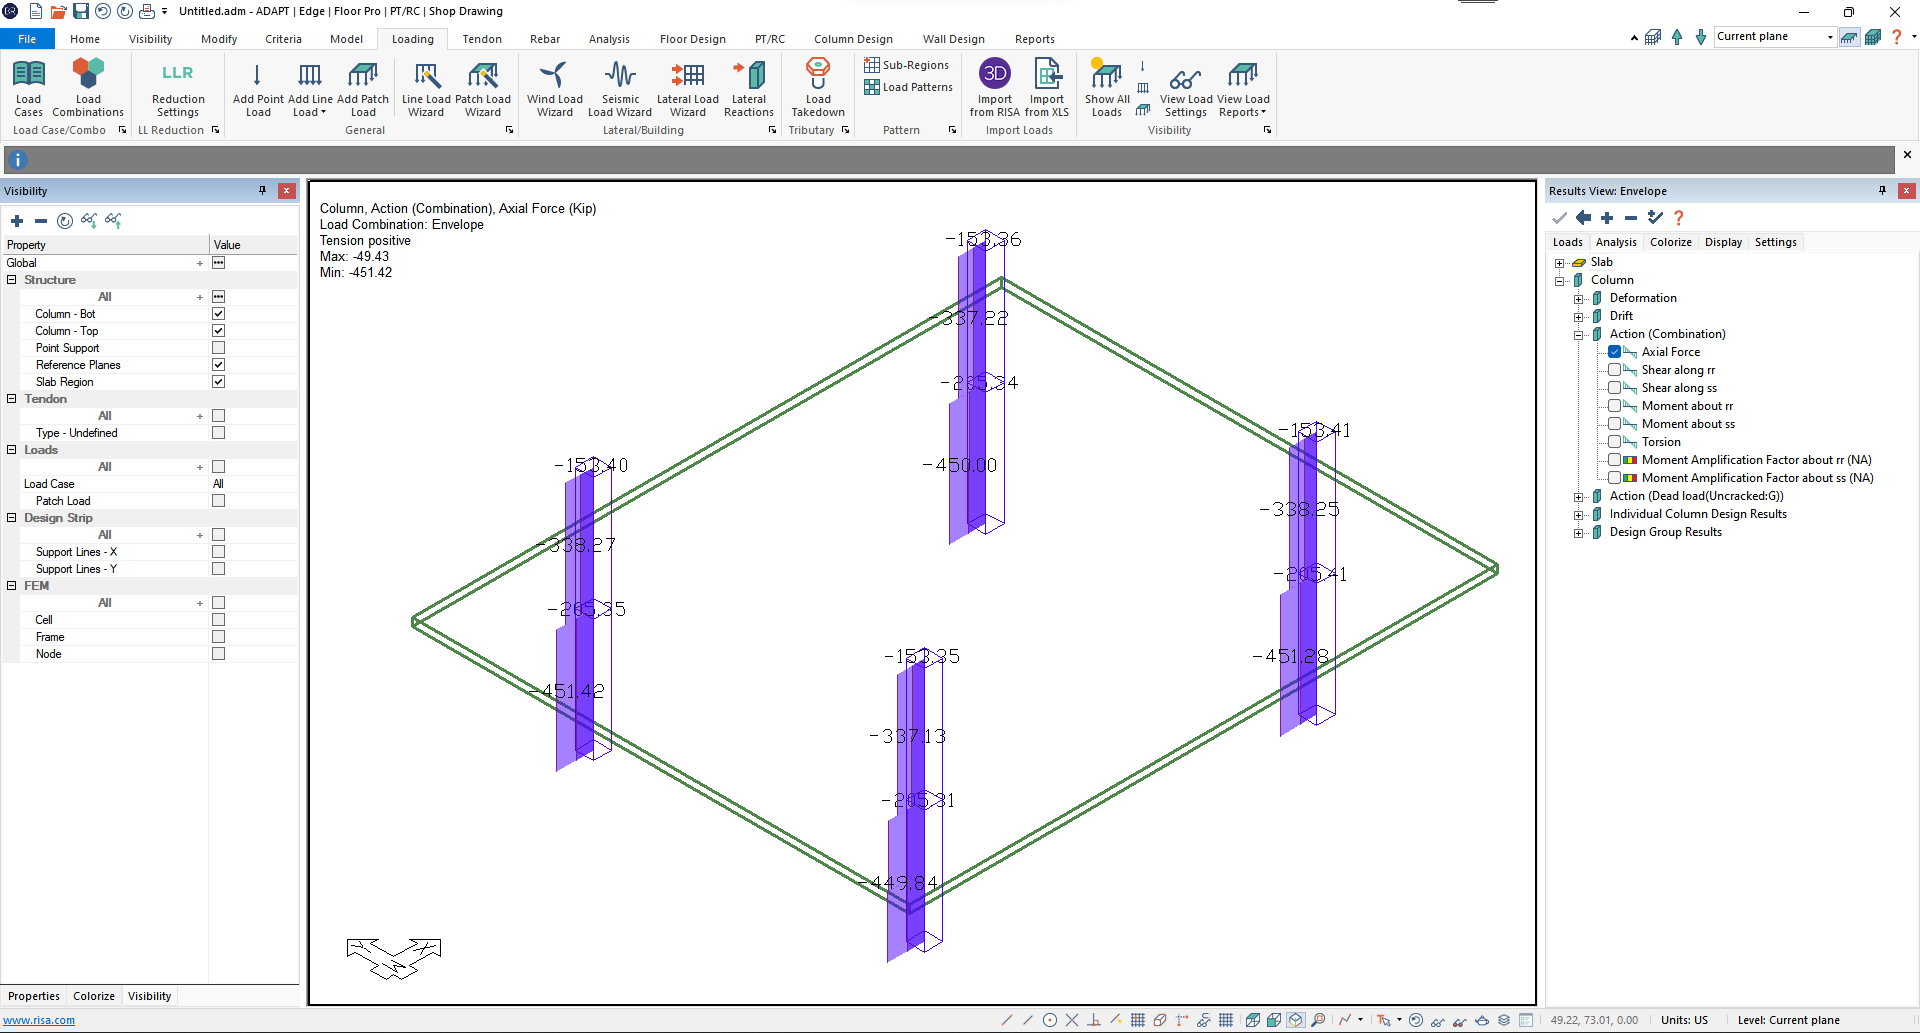
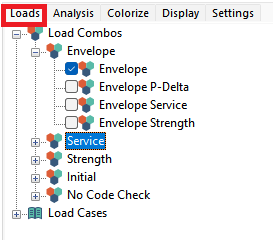
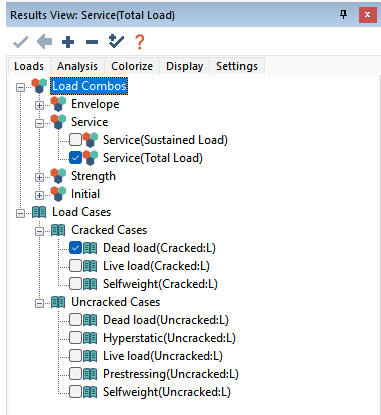
Click on the Loads tab of the Results View panel.
-
Check the box next to the Load Combination or Load Case result you want to view. In the image above we have chosen the Envelope result.
-
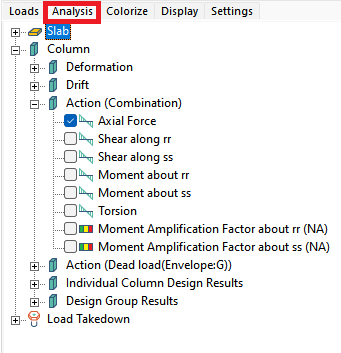
Click on the Analysis tab of the Results View panel.
-
Check the box next to the result you want to view. In the image above we have chosen the Column Axial force result.
Note: If the result you want to view is inactive you may need to be on a different load combination to activate those results. For example, the punching shear results are only available when an individual Strength combination or the Envelope Strength combination is chosen.
-
Click on the blue check markicon at the top of the Results View panel. The results on plan will update to be based on your selection.
-
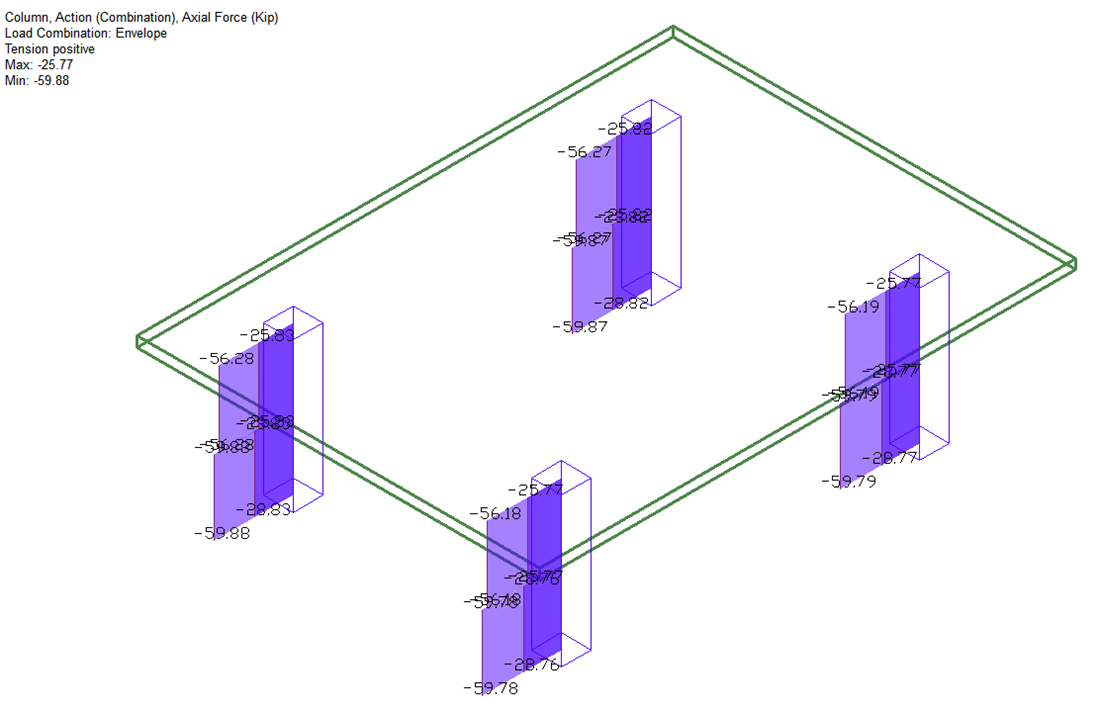
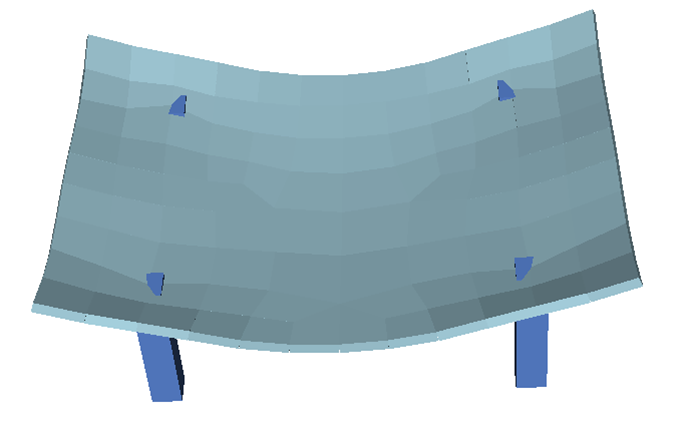
Navigate and change the view of the model to review the result. Below we are showing the envelope axial force within the columns in an isometric view. The legend in the upper left of the model space will show the load combination and result displayed on plan.
Click image to enlarge
To view load case reactions for columns and walls:
We can view the individual load case reactions for columns and walls for each Usage Case analyzed by the model.
-
After you have run the analysis for each usage case you want to view reactions for go to the Loads tab of the Results View panel.
-
Expand the Load Cases tree to see the different load case solutions available. The usage case name and analysis mode for the usage case is appended at the end of the load case name, for example, (Uncracked:L). An L denotes level analysis where a G denotes global analysis.
-
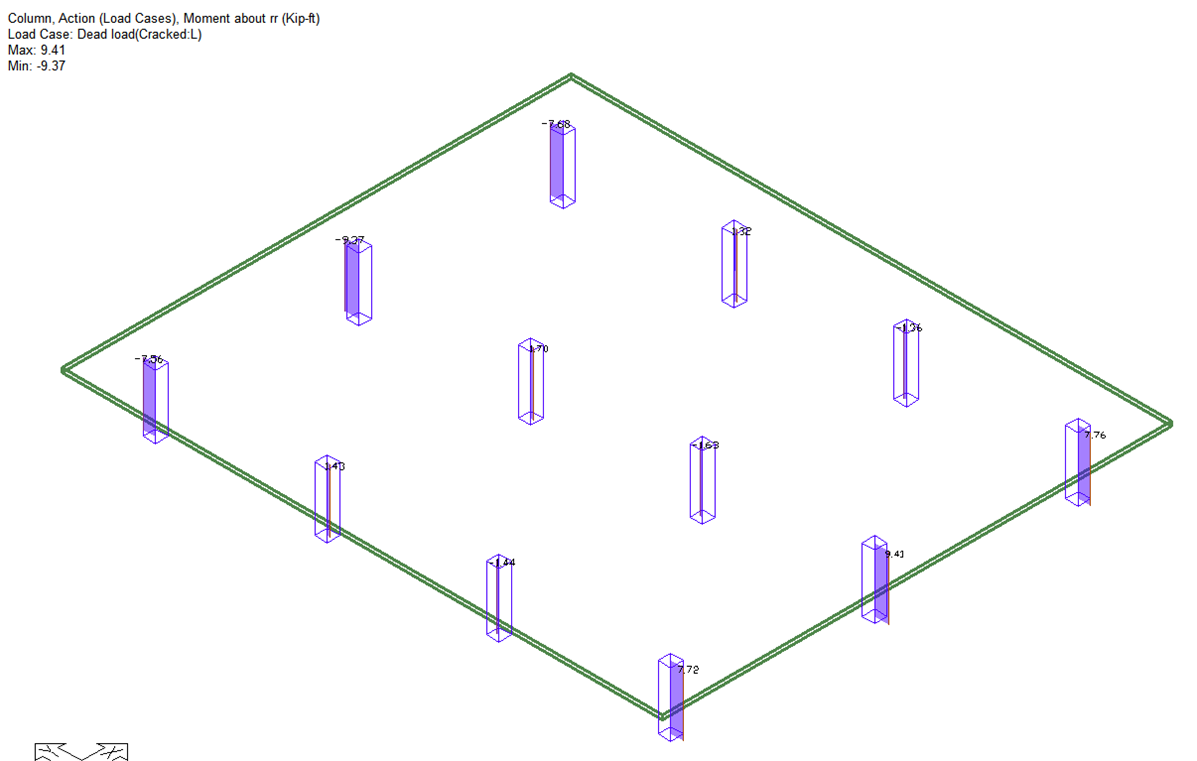
Select the load case you want to review the result for. In the example above we have chosen the Cracked Dead Load case.
-
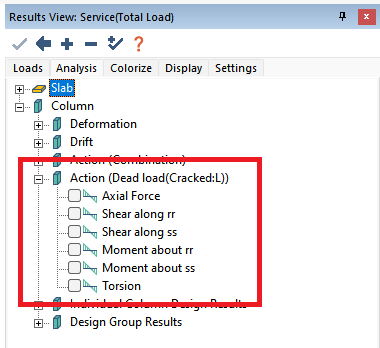
Click on the Analysis tab of the Results View panel. Expand the Column or Wall tree depending on the result you want to view.
-
Expand the Action (Load Case: (Usage Case:Analysis Mode)) tree.
-
Choose a result to see on plan, in our example we are showing the Moment about rr.
Click image to enlarge
To toggle display of result text:
For any analysis result that is not a contour result the result text can be displayed by completing the following.
-
Display an analysis result you want to view.
-
Go to Floor Design>Strip Results Visibility panel.
-
You have two options for turning on text.
-
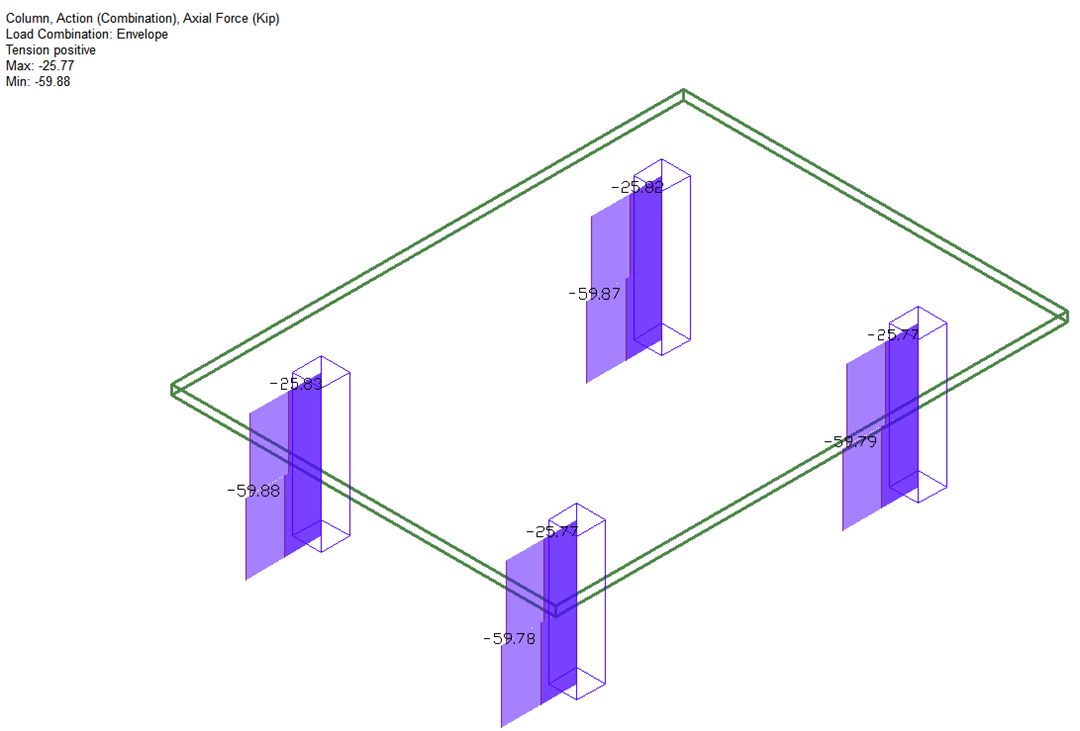
You can click the Display Max/Min Values  icon to see the max and minimum result value for each component or support line.
Click image to enlarge
-
You can click the Display Numerical Values  icon to see all result values along the component or support line.
Click image to enlarge
To modify the font height of result text:
-
With the analysis result and its associated text displayed open the Result View panel by clicking on the Results Display Settings icon in the bottom quick access toolbar.
-
Click on the Setting tab.
-
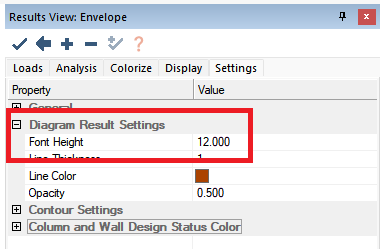
Expand the Diagram Result Settings tree and find the Font Height input.
-
Enter the new font height and click the blue check mark icon at the top of the Results View panel. The result font will update on screen.
To modify the scale of result text:
-
Display an analysis result you want to view.
-
Go to Floor Design>Strip Results Visibility panel.
-
You have a few options for manipulating the scale of the analysis results (excluding contour results). Click on the icon whose action you want to perform.
-
Results Scale Up Values 
-
Results Scale Default Values 
-
Results Scale Down Values 
-
The result diagram scale will increase, decrease, or return to the default scale depending on the option chosen.
To view and edit the display contour results:
You have options to modify the display of the contour results. The options to modify contour results can be found in Analysis>Contour Settings panel as well as in the Results View panel Settings tab.
-
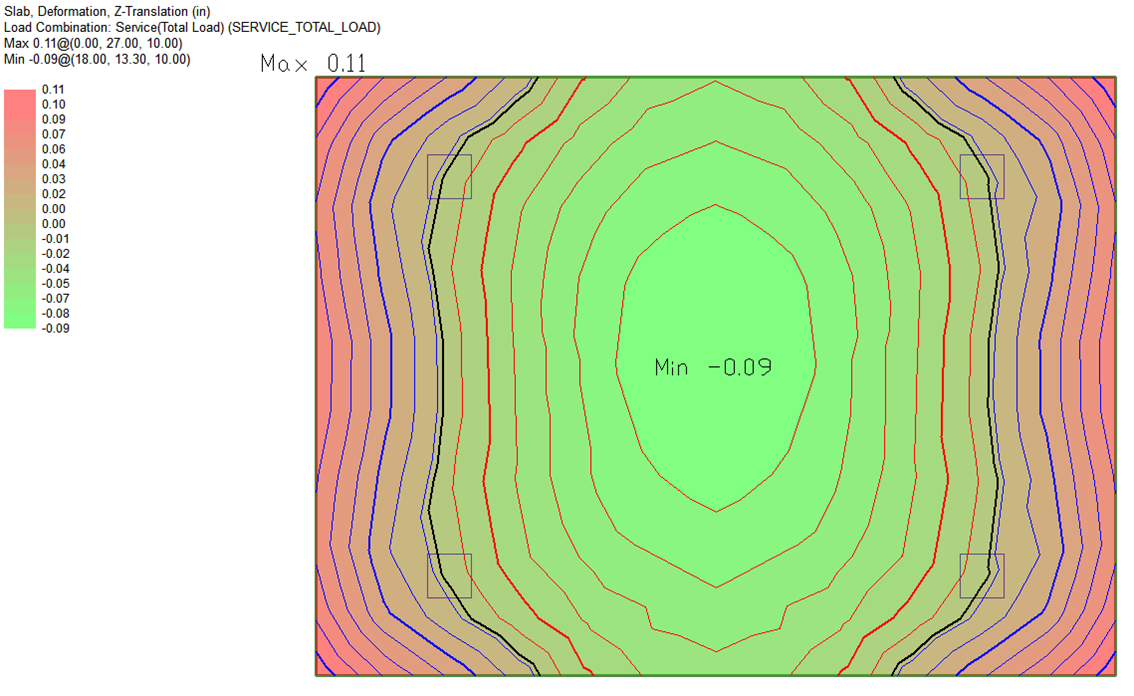
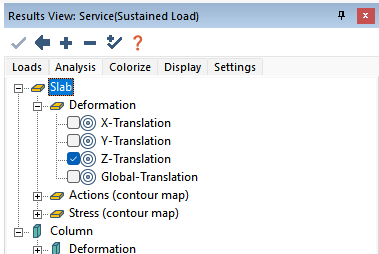
Open the Results View panel and select the contour result you want to view. In the example below we have chosen to view the Z-Translation contour for the slab region.
Note: Contour Results are dilineated by a

in the Results View panel Analysis tab.
-
If the contour result does not display, click on the Display Contour  icon of the Analysis ribbon.
Click image to enlarge
-
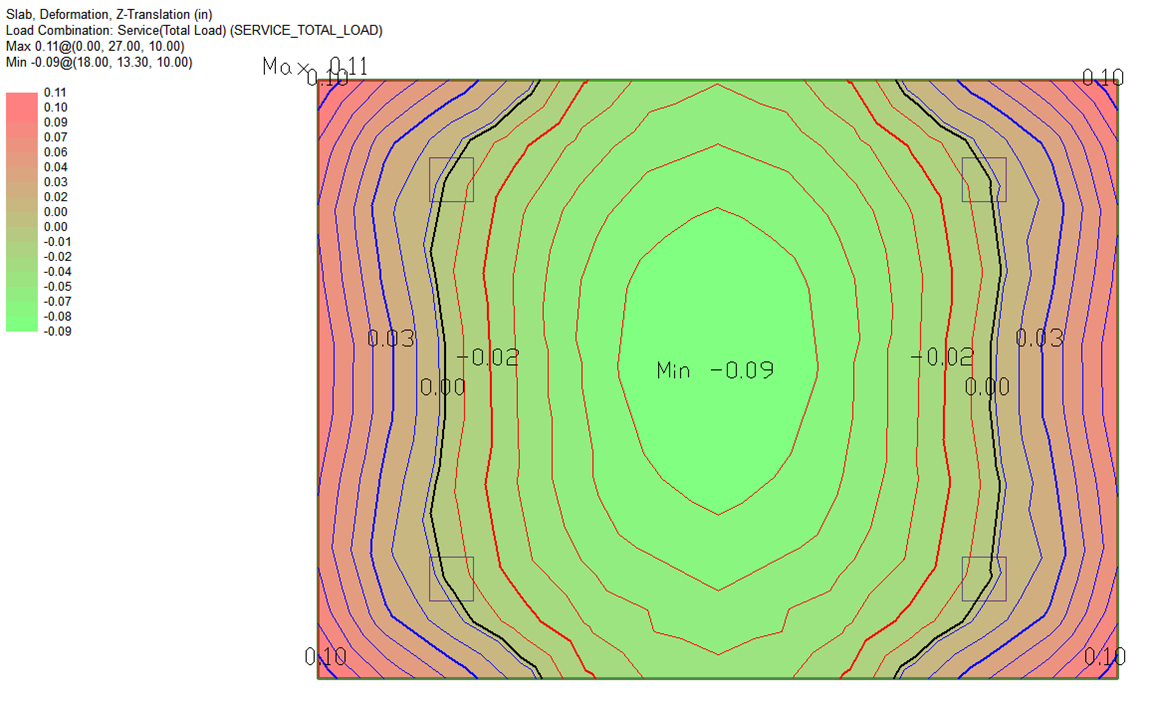
The max and min values for the contour will be shown. To view values other than the max and min values go to the Analysis>Contour Settings and click on the Display/Hide Text on Line Contours icon.
Click image to enlarge
-
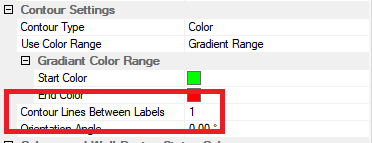
You can increase the number of labeled contours by going to the Results View panel Settings tab and modifying the value for Contour Lines Between Labels.
Click image to enlarge
-
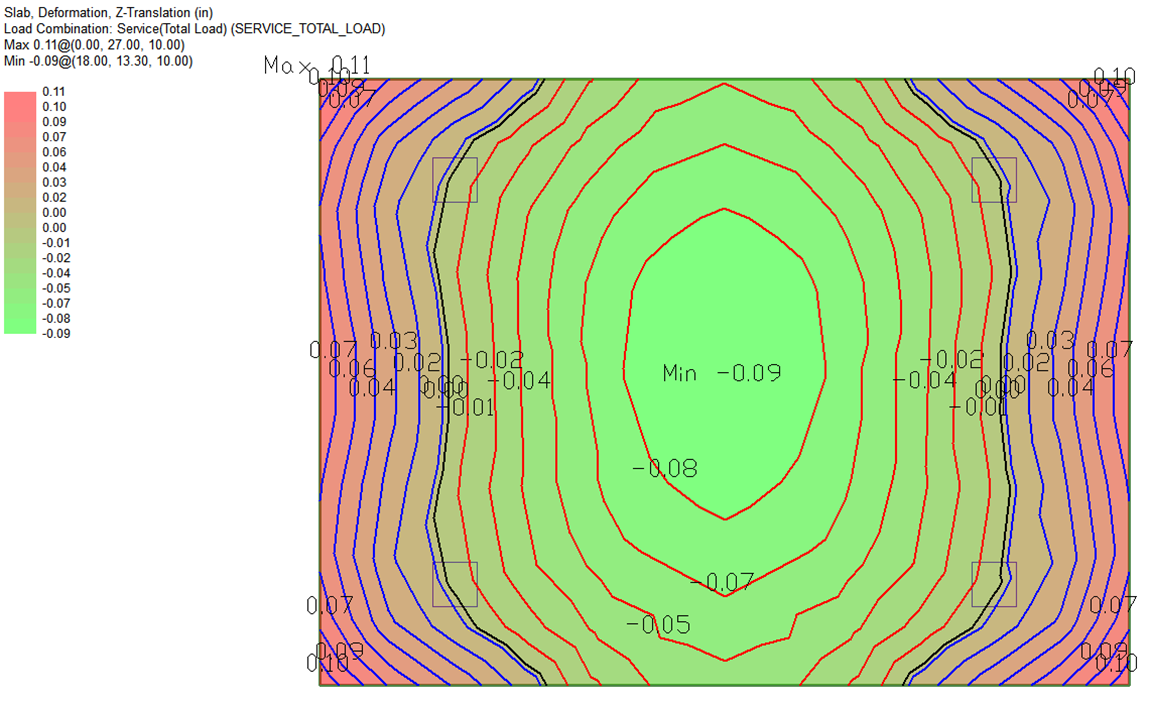
You can increase or decrease the number of line contours shown on plan by going to Analysis>Contour Settings panel and clicking on the Increase Number of Contour Lines or Decrease Number of Contour Lines
 icons.
Click image to enlarge
Click image to enlarge
-
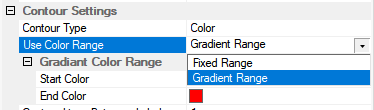
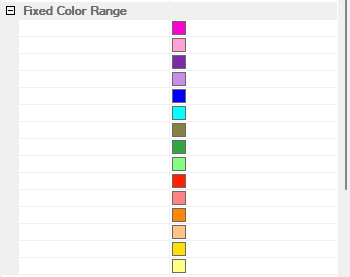
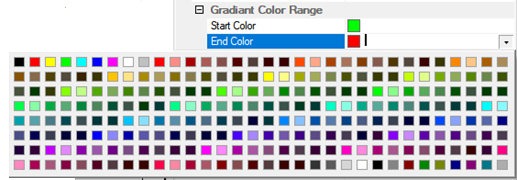
Lastly, you have the ability to display the contour result with gradient coloring or fixed coloring. Go to the Result View panel Settings tab, locate and expand the Contour Settings tree. Click on the cell to the right of the Use Color Range input and choose either Fixed Range or Gradient Range from the drop down list.
-
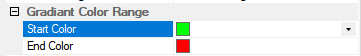
Once Gradient or Fixed range is chosen, you will have options in the Results View panel Settings tab to modify the color used for the gradient or fixed color ranges.
Gradient Color Range:
Fixed Color Range:
-
You can click on a color to expand the color palette and choose a new color for that chosen input.
To display a 3-D rendered view of a contour result:
You have the ability to show a 3-D view of the model showing the deflected shape.
-
Turn on the contour result you want to see a solid modeling view of in the Results View window Analysis tab.
-
Once the contour is displayed on screen click on the View Model  icon of the quick access toolbar. This will open a view similar to the following image.
Click image to enlarge
-
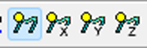
You can click on the Show/Hide 3D Warp icons shown below to display the warped contour.
-
You can then rotate the view using their mouse or the view icons in the window to see the warped shape more clearly. This view helps you see any connectivity issues within their model.
Click image to enlarge
-
You can increase and decrease the scale of the warp using the Increase  and Decrease Warping Scale
  icons.
View Graphical Analysis Results - ADViewer
The ADViewer is a legacy result viewer that still has some very useful features when viewing the analysis results. The ADViewer allows you to view analysis results graphically by load combination. The results/actions for Slabs, Beams, Columns, and Walls can all be viewed through the ADViewer. You can also modify the appearance of results as well as components within the ADViewer.
Once an analysis completes, you can open the ADViewer at any point. Open the ADViewer by going to Analysis>Analysis and clicking the View Analysis Results icon, as shown in the following image.
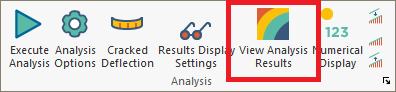
The ADViewer interface will open.
Click image to enlarge
To view results in ADViewer:
-
Go to Analysis>Analysis and choose the View Analysis Results  icon to open the ADViewer.
-
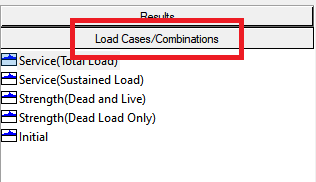
With the ADViewer open click on the Loads/Load Combinations option on the left-side pane as shown below.
-
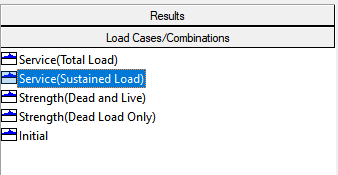
Select the load combination you would like to view the result for. In this example we have chosen Service (Sustained Load).
-
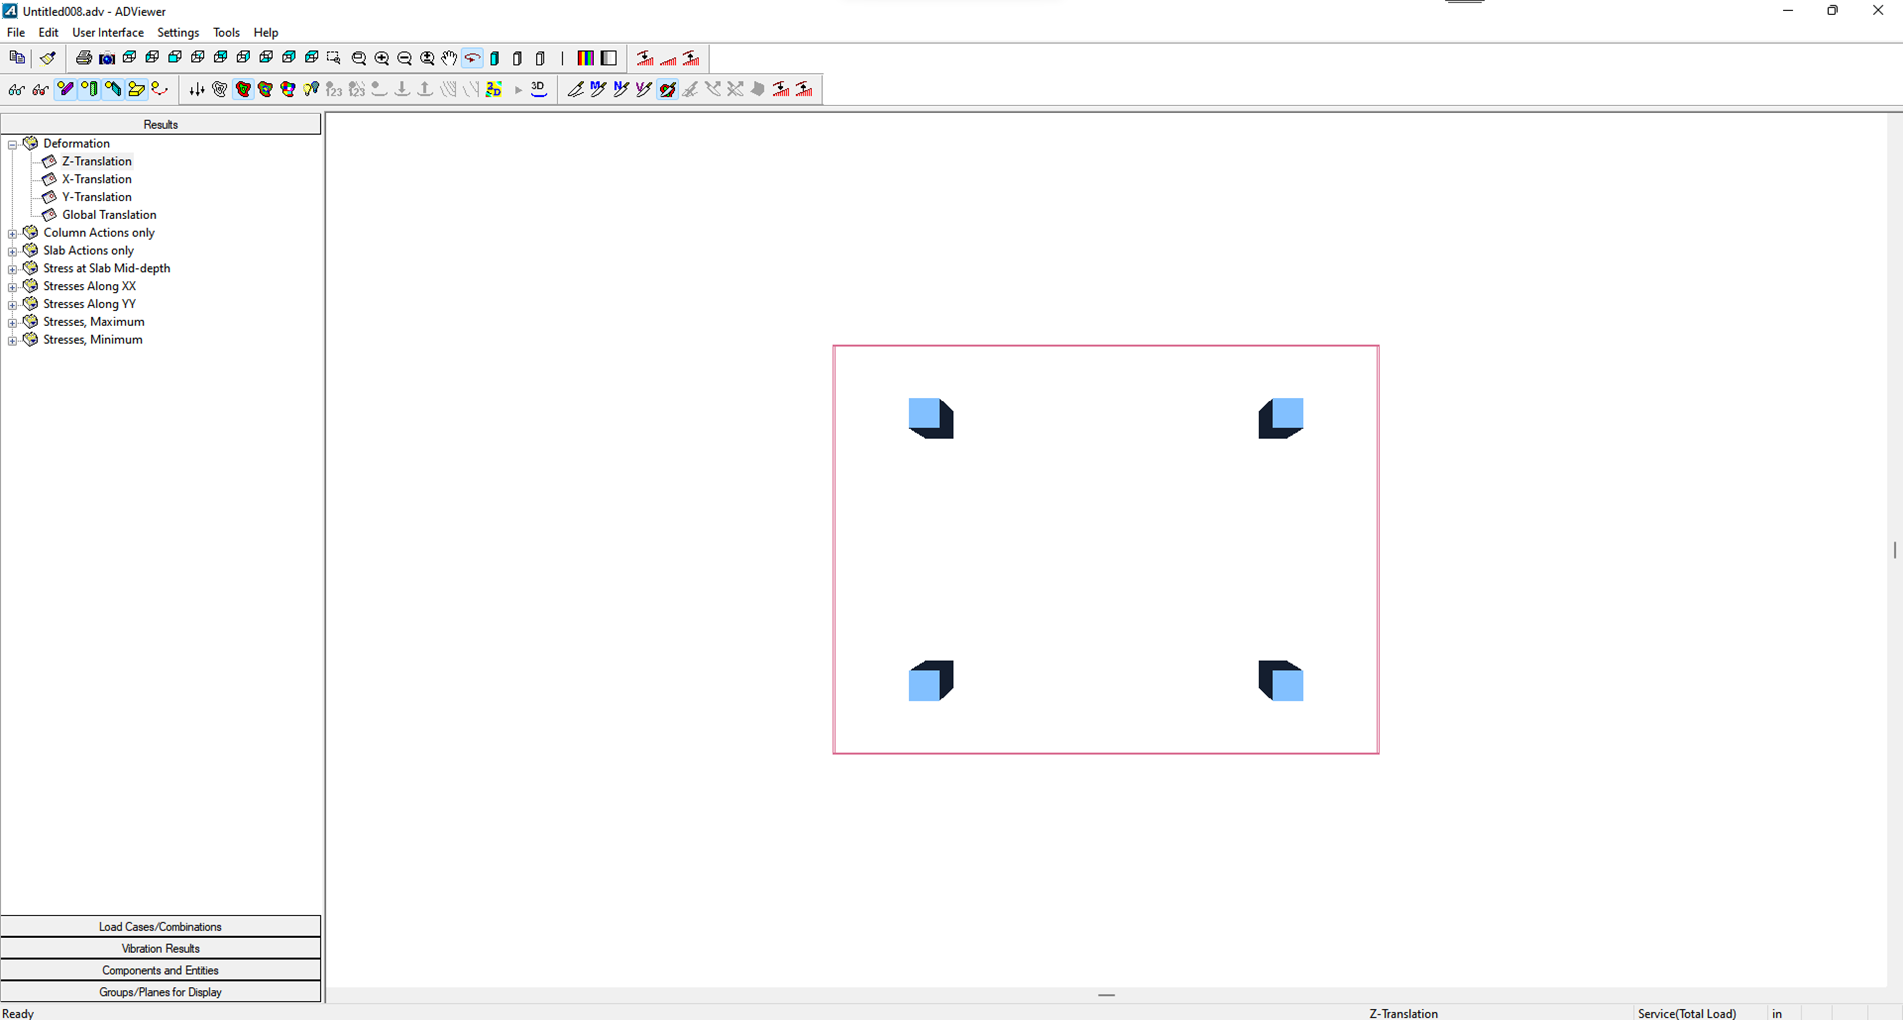
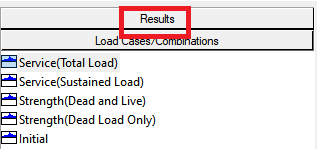
Click on the Results option in the left-side pane as shown below.
-
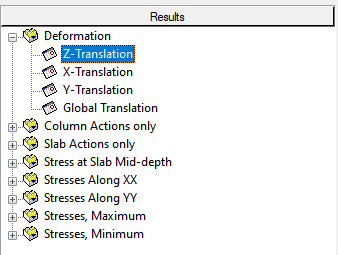
Select the result from the Results tree that you want to view. In this example we have choose the Deformation Z-Translation result.
-
Once the Load Combination and Result that you want to view have been selected click on the Display Results  icon to display the result on plan.
Click image to enlarge
-
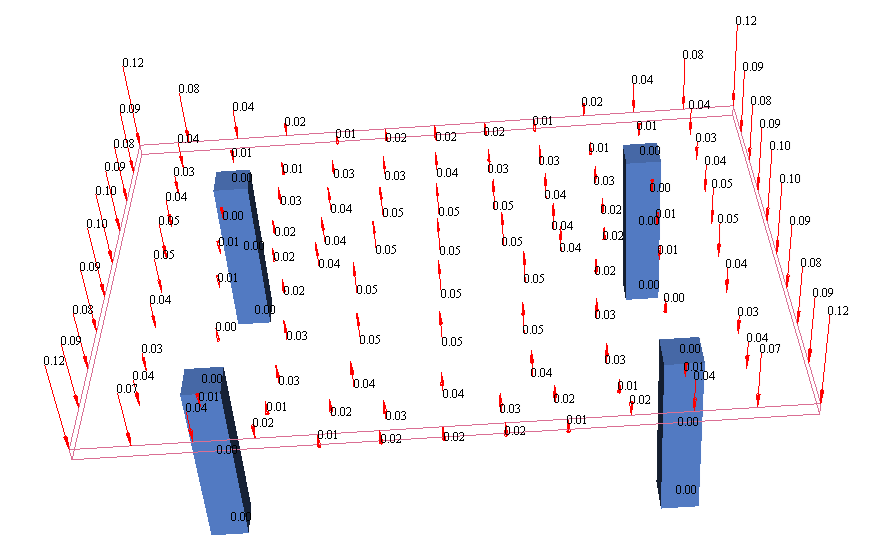
If the contour result does not display click on the Color Contour  icon. You have the following options to display the contour results. The main three used show an example of the result.
-
Vector Plot 
Click image to enlarge
-
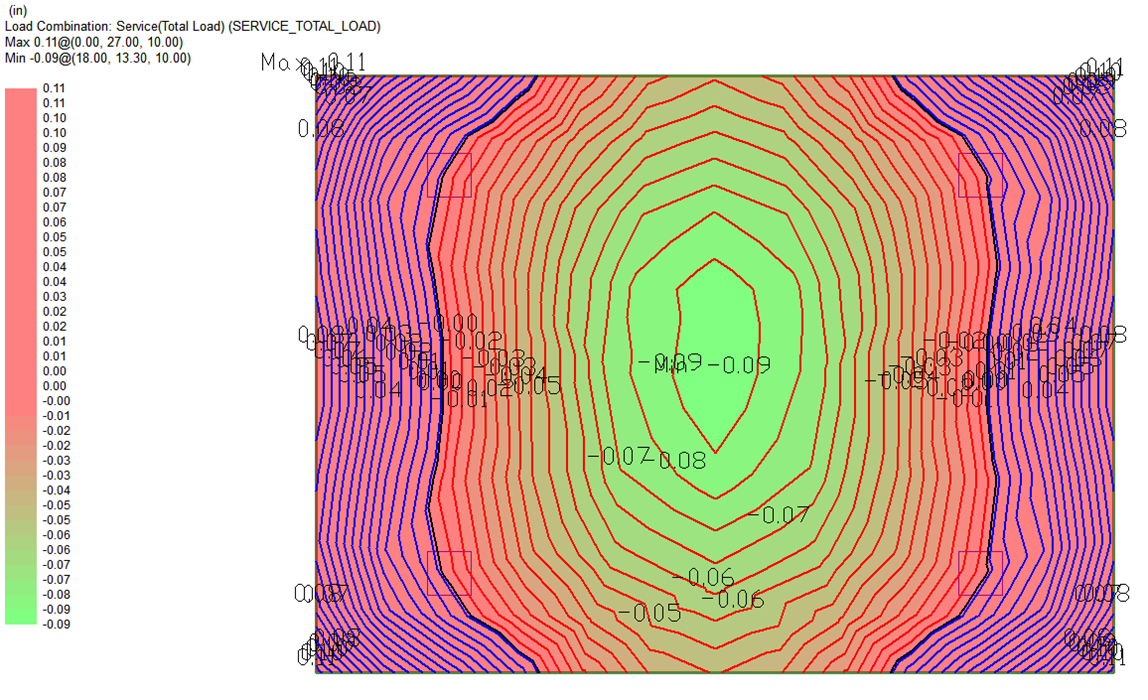
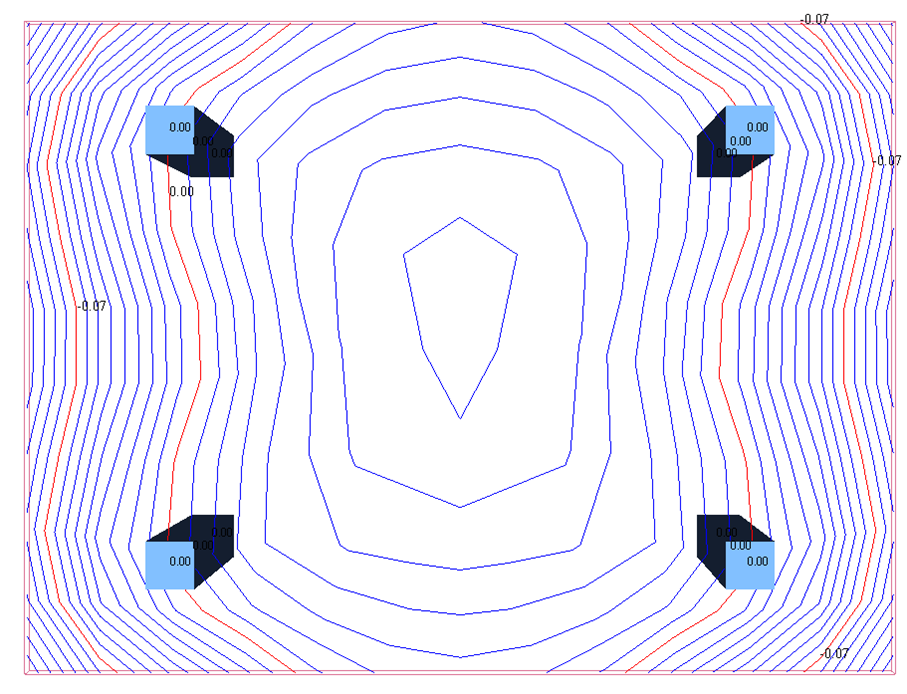
Line Contour 
Click image to enlarge
-
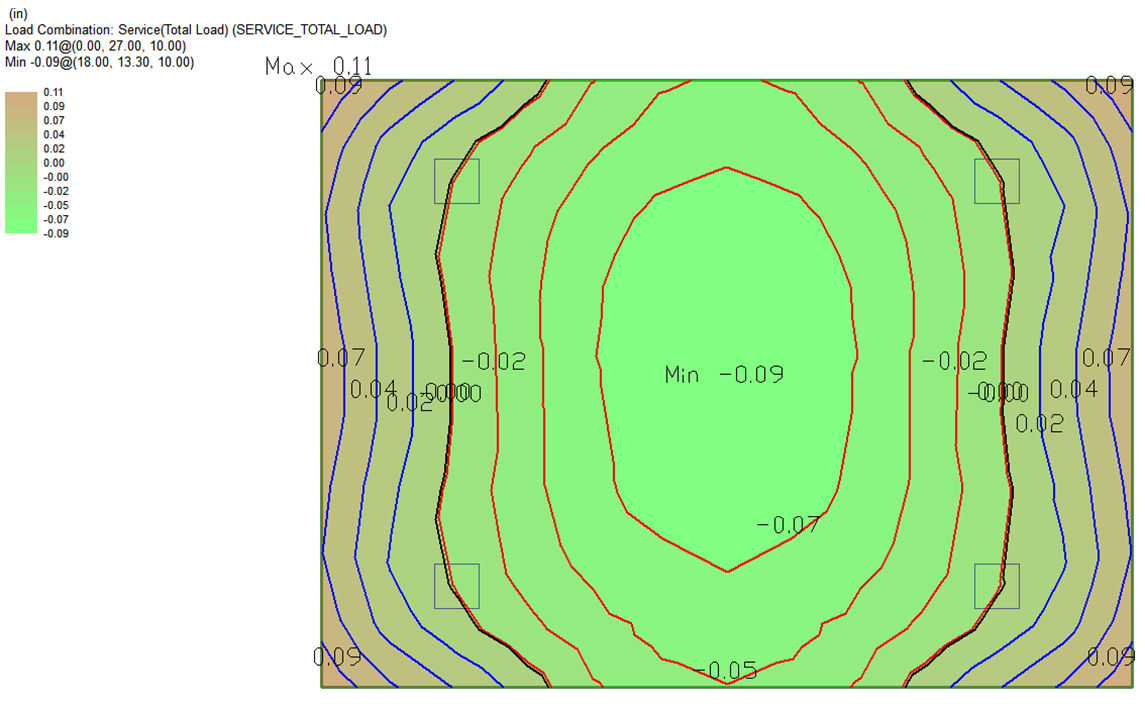
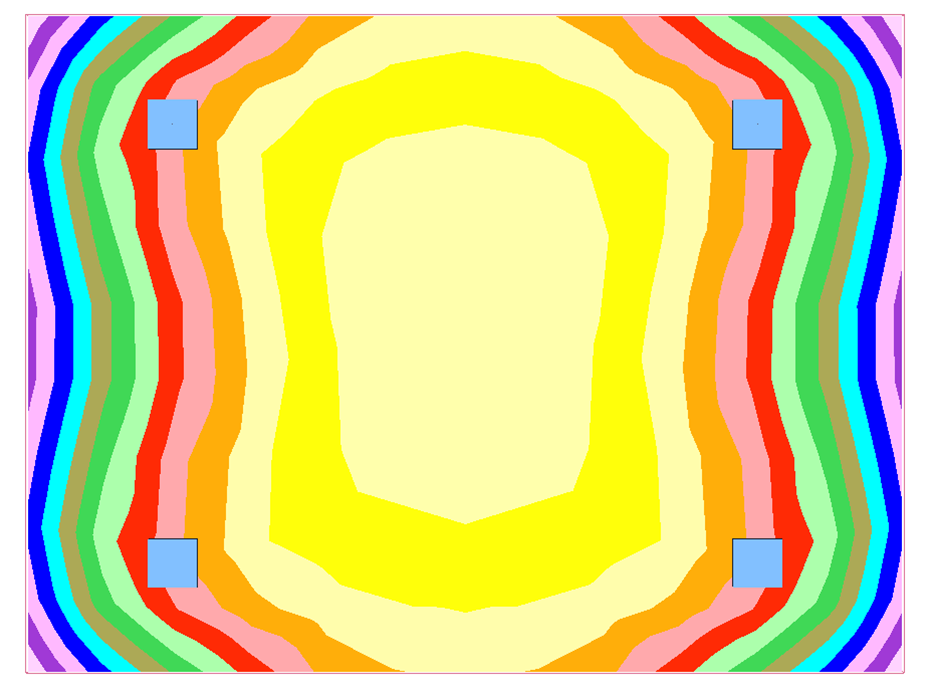
Color Contour
Click image to enlarge
-
Intensity Contour 
-
Max Value Contour 
-
You can turn on and off result text by clicking on the Display Numerical Result  icon or Display Numerical Results for Contours
  icon.
icon.
-
You can also warp the display of the contour using the Warp/Cancel Warping  icon.
icon.
Click image to enlarge
-
You can increase and decrease the warping scale by clicking on the Increase Warping  icon and Decrease Warping
  icon.
icon.
-
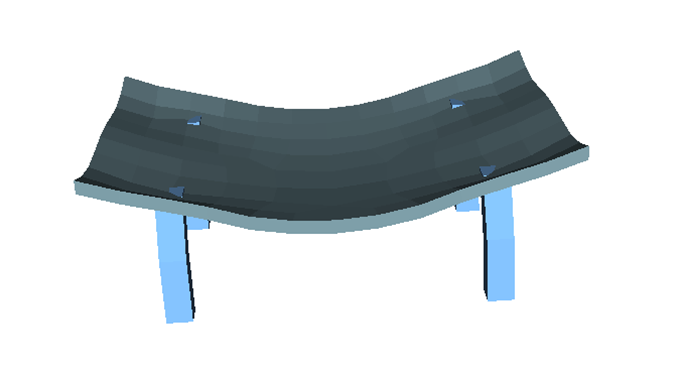
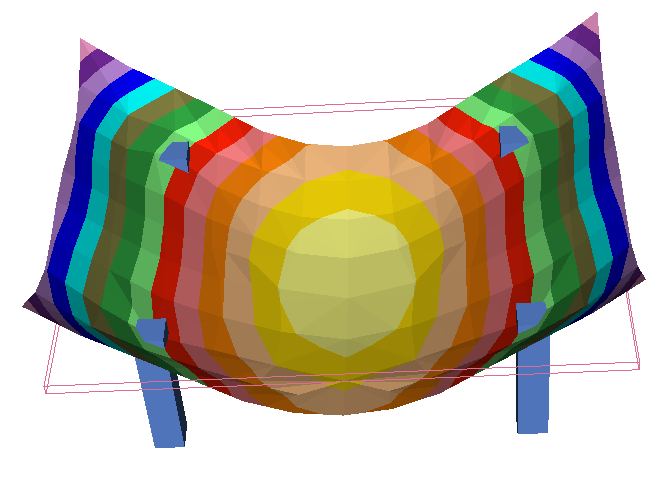
You can also choose to see a 3-D view of the deflected shape of the model by clicking on the 3-D Contour View  icon.
icon.
Click image to enlarge
To modify appearance of ADViewer results:
You have additional options for modifying the appearance of results through the Results Display Settings icon within the ADViewer.
-
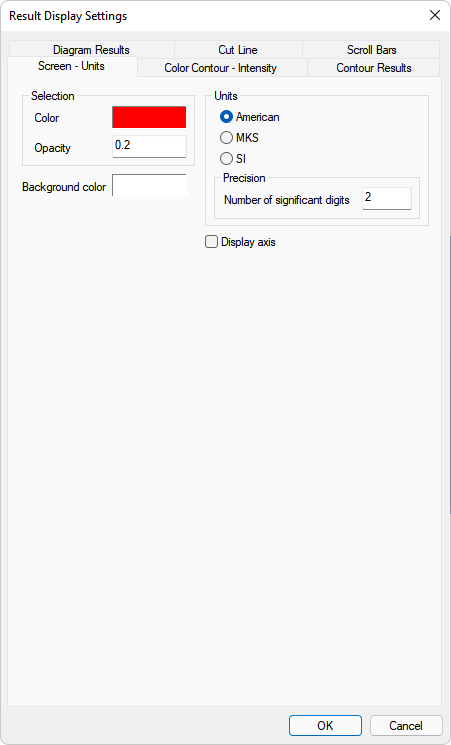
Click on the Results Display Settings icon to open the Results Display Settings dialog window.
Click image to enlarge
-
Navigate to the tab for the result you want to modify.
-
Modify the settings for that result.
-
Click OK to see the outcome of the settings on the display of the results on plan.
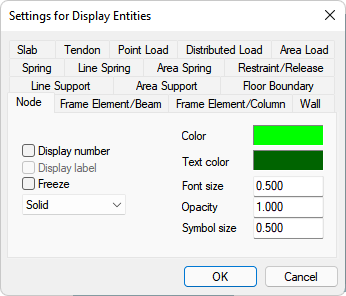
To modify appearance of ADViewer components:
-
You have additional options for modifying the appearance of components in the ADViewer through the Entity Display Settings icon within the ADViewer.
-
Navigate to the tab for the component you want to modify.
-
Modify the settings for that component.
-
Click OK to see the outcome of the settings on the display of the components on plan.