Results View Panel
The Results View panel allows you to view analysis/design results, graphically by load combination/load case. The results/actions for Slabs, Beams, Columns, Walls, Design Strips, Punching Shear results, and more can be viewed. You can also edit the code check limits as well as the display of graphical results within the model space.
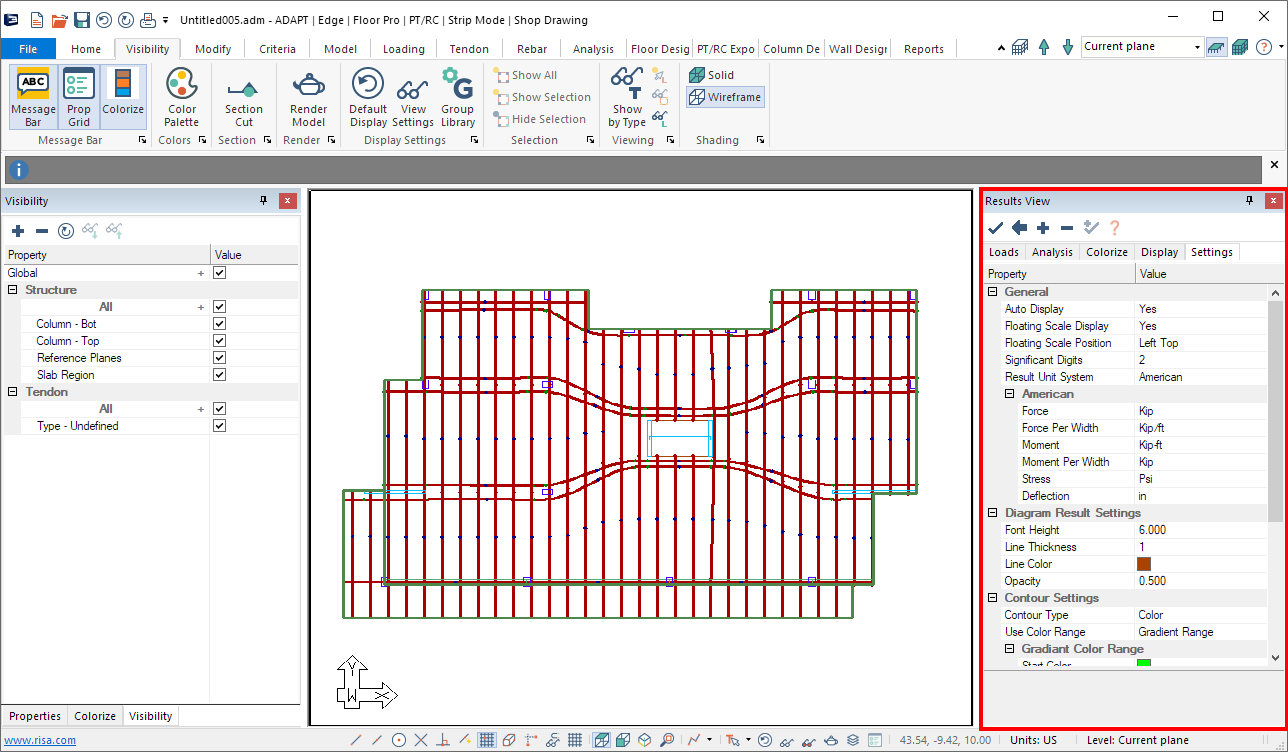
Once an analysis completes, the Results View panel automatically opens. If however, you want to open the panel at any other point, you can do it by going to Analysis > Analysis and clicking the Results Display Settings icon, as shown in the following image. Alternatively you can access the same icon from the Bottom Quick Access toolbar.
Results View Panel Interface
The Results View panel opens on the right side of the model editing panel (as shown in the following image) once an analysis has completed, or when you choose to open the panel from the Analysis ribbon.
Where the Results View panel displays, in relation to the program window
Click on image to enlarge
You can dock the Results View panel on any side of the modeling interface, allow it to float on screen and automatically hide it when you move focus from the panel. See Float, Dock, and Hide Panels for more details.
Results View Panel Icons
We have a few icons at the top of the Results View panel; Apply Changes, Clear All, Expand All, Collapse All, Expand Selected and Help, shown below.
Results View panel icons
The purpose of each icon is described in the following table.
|

|
Apply Changes
|
Applies any settings changes you have made in the Results View panel.
|
|

|
Clear All
|
Clears any active results from the Analysis tab.
|
|

|
Expand All
|
Expands all branched items.
|
|

|
Collapse All
|
Collapses all branched items.
|
|

|
Expand Selected
|
Expands only the branches in the Analysis tab that include a selected result. Helps you locate a selected (checked) result in the tree, when the tree branch the result is under is not expanded. As the branch with the selected result opens, all other currently expanded branches are collapsed so that you can easily find the selected result.
This icon is only active on the Loads, Analysis and Colorize tabbed panels, as they are the only panels in which you can choose a result to view.
|
|

|
Help
|
Opens a pop-up help window specific to the item currently highlighted in the Results View panel.
This icon is only active on the Loads, Analysis and Colorize tabbed panels, as they are the only panels in which you can choose specific items you want to view.
|
Results View Panel Tabs
The Results View panel consists of several tabbed panels; Loads, Analysis, Colorize, Display and Settings. The first three panels provide options for choosing what you want to view, while the last two panels provide a means for changing property values in sub-categories.
Loads tab
The Loads tabbed panel lists solved combinations for each analysis/design option group and envelope. Load combination results apply to all analysis graphical result classifications in the Analysis tab.
You can choose the load combination, envelope group of load combinations, or load case of the result you would like to review, and where you select what load case or load combination you want to view the result for.
Loads Branches
|
Load Combos
|
Lists solved combinations for each analysis/design option group and envelope. Load combination results apply to all analysis graphical result classifications in the Analysis tab. The branch also shows the results of envelopes.
| Envelope |
Set results envelope for solved Service, Strength, Initial or P-Delta combinations or combined envelope. |
| Service |
Set results for solved combinations set to the Service analysis / design option type from Loading - Load Combinations.
|
| Strength |
Set results for solved combinations set to the Strength analysis/design option type from Loading-Load Combinations. |
| Initial |
Set results for solved combinations set to the Initial analysis/design option type from Loading-Load Combinations. |
| P-Delta |
Set results for solved combinations set to the P-Delta analysis/design option type from Loading-Load Combinations. |
| No Code Check |
Set results for solved combinations set to the No Code Check analysis/design option type from Loading-Load Combinations. |
| Cracked Deflection |
Set results for solved combinations set to the Cracked Deflection analysis/design option type from Loading-Load Combinations. |
| Long-Term Deflection |
Set results for solved combinations set to the Long-Term Deflection analysis/design option type from Loading-Load Combinations. |
|
|
Load Cases
|
Lists solved load cases for Single-Level (L) and Multi-Level (G) analysis runs for the listed usage cases. 'Uncracked' is the default usage case.
Load case results only apply to Column and Wall action diagrams in the Analysis tab of the Results View panel.
Note that Imported reactions from Tekla Strucural Designer (TSD) and CSI-Etabs are imported as Multi-Level (G) reactions and listed as such.
|
Back to Results View Panel Tabs
Analysis tab
The Analysis tabbed panel sets the graphical results display for FEM analysis results, component design, and tributary load takedown.
You can view result contours and diagrams for components (slabs, beams, columns, walls, etc.). Expand the category tree by clicking on the + sign next to the category you would like to see available results for.
Note: The available results depend on if the analysis, design, or shear check have been completed. Available results also depend on the Load Case/Combination selected under the Loads tab of the Results Display Viewer. Contour results are not displayed for Enveloped results, you must select a single load combination to view a contour results.
For items that are code checked the text of the specific result in the Results Display Viewer shows in a red color with (NG) appended to the text or a green color with (OK) appended to the end of the text. If one section in the active level fails the check for that result the text will show as red. If all sections in the active level pass the check the check will be shown as green. The design section results are only valid for the last analyzed and designed level.
A list of the results found in each branch is shown in the following table.
Analysis Branches
|
Slab
|
Lists selection options for slab graphical results display.
| Deformation |
Lists selection options for slab deformation contour results display.
-
X-Translation: Displays contour results for slab deformation in global X direction. Positive follows global X axis orientation.
-
Y-Translation: Displays contour results for slab deformation in global Y direction. Positive follows global Y axis orientation.
-
Z-Translation: Displays contour results for slab deformation in global Z direction. Positive follows global Z axis orientation.
-
Global-Translation: Displays column frame element results for combined global deformation.
|
Actions
(contour map) |
Lists selection options for slab actions contour results display.
-
Nxx – Axial: Displays in-plane axial force contours in global X direction.
-
Nyy – Axial: Displays in-plane axial force contours in global Y direction.
-
Nxy – Inplane Shear: Displays XY in-plane shear contours.
-
Mxx: Displays slab moment contours for bending about global X direction. Positive indicates compression at top fiber.
-
Myy: Displays slab moment contours for bending about global Y direction. Positive indicates compression at top fiber.
-
Mxy: Displays slab twisting moment contours. Positive indicates compression at top fiber.
-
Cracks along Strip Y – (width): Displays crack width contours along Y strip direction. Only available for individual service combinations after design of sections is completed.
-
Cracks along Strip X – (width): Displays crack widths contours along X strip direction. Only available for individual service combinations after design of sections is completed.
-
Reduced rotational stiffness about XX: Displays contours representing ratio of Ieff/Ig for bending about XX global axis. Only available when a cracked case of a cracked deflection combination is selected in the Loads tab.
-
Reduced rotational stiffness about YY: Displays contours representing ratio of Ieff/Ig for bending about YY global axis. Only available when a cracked case of a cracked deflection combination is selected in the Loads tab.
|
Stress
(contour map) |
Lists selection options for slab stress contour results display.
-
Mid-depth along XX: Displays centroid stress contour along global X direction. Positive indicates tension.
-
Mid-depth along YY: Displays centroid stress contour along global Y direction. Positive indicates tension.
-
Top fiber along XX: Displays top fiber stress contour along global X direction. Positive indicates tension.
-
Bottom fiber along XX: Displays bottom fiber stress contour along global X direction. Positive indicates tension.
-
Top fiber along YY: Displays top fiber stress contour along global Y direction. Positive indicates tension.
-
Bottom fiber along YY: Displays bottom fiber stress contour along global Y direction. Positive indicates tension.
-
Maximum top fiber: Displays maximum top fiber principal stress. Positive indicates tension.
-
Maximum bottom fiber: Displays maximum bottom fiber principal stress. Positive indicates tension.
-
Minimum top fiber: Displays minimum top fiber principal stress. Positive indicates tension.
-
Minimum bottom fiber: Displays minimum bottom fiber principal stress. Positive indicates tension.
-
Soil pressure: Displays soil pressure distribution contour. Negative indicates compression. Only available in MAT mode.
|
|
|
Column
|
Lists selection options for column graphical results display.
| Deformation |
Lists selection options for column element deformation results display.
-
rr-Translation: Displays frame element results for column deformation in local rr direction. Positive follows local rr axis orientation.
-
ss-Translation: Displays frame element results for column deformation in local ss direction. Positive follows local ss axis orientation.
-
Z-Translation: Displays frame element results for column deformation in Z direction. Positive follows global axis orientation.
-
Global-Translation: Displays column frame element results for combined global deformation.
|
| Drift |
Displays the inter-story drift % relative to the reference plane height for the selected load combination and produces a graphical check for Acceptable or Unacceptable for Drift Maximum Allowable display setting defined by you.
-
Drift Combined: Displays the drift results and code check for global displacements for the selected combination or envelope.
-
Drift X: Displays the drift results and code check for X-direction displacements for the selected combination or envelope.
-
Drift Y: Displays the drift results and code check for Y-direction displacements for the selected combination or envelope.
-
Drift Combined Amplification Factor: When P-Delta combinations are selected, this option displays the ratio of the 2nd order to 1st order drift relative to global displacements. The drift ratios are calculated for the top and bottom nodes of column components and the maximum ratio is reported. This option is set to “NA” when a non P-Delta combination is selected.
-
Drift X Amplification Factor: When P-Delta combinations are selected, this option displays the ratio of the 2nd order to 1st order drift relative to X-direction displacements. The drift ratios are calculated for the top and bottom nodes of column components and the maximum ratio is reported. This option is set to “NA” when a non P-Delta combination is selected.
-
Drift Y Amplification Factor: When P-Delta combinations are selected, this option displays the ratio of the 2nd order to 1st order drift relative to Y-direction displacements. The drift ratios are calculated for the top and bottom nodes of column components and the maximum ratio is reported. This option is set to “NA” when a non P-Delta combination is selected.
|
Action
(Combination) |
Lists selection options for column element action results for selected load combination or envelope.
-
Axial Force: Displays frame element results for column axial force in global Z direction. Positive indicates tension.
-
Shear Along rr: Displays frame element results for column shear force in local rr direction.
-
Shear Along ss: Displays frame element results for column shear force in local ss direction.
-
Moment about rr: Displays frame element results for column moment about local rr direction. Positive indicates compression on local ss column face.
-
Moment about ss: Displays frame element results for column moment about local ss direction. Positive indicates compression on local rr column face.
-
Torsion: Displays frame element results for column torsion about Global Z direction.
-
Moment Amplification Factor about rr: When P-Delta combinations are selected this option reports the ratio of 2nd to 1st order moments about the local r-r column axis. The moment ratios are calculated for the top and bottom nodes of column components and the maximum ratio is reported. This option is set to “NA” when a non P-Delta combination is selected.
-
Moment Amplification Factor about ss: When P-Delta combinations are selected this option reports the ratio of 2nd to 1st order moments about the local s-s column axis. The moment ratios are calculated for the top and bottom nodes of column components and the maximum ratio is reported. This option is set to “NA” when a non P-Delta combination is selected.
|
Action
(Load Case(Usage: Level or Global)) |
Lists selection options for column element action results for selected load case, usage and solution mode.
-
Axial Force: Displays frame element results for column axial force in global Z direction. Positive indicates tension.
-
Shear Along rr: Displays frame element results for column shear force in local rr direction.
-
Shear Along ss: Displays frame element results for column shear force in local rr direction.
-
Moment about rr: Displays frame element results for column moment about local rr direction. Positive indicates compression on local ss column face.
-
Moment about ss: Displays frame element results for column moment about local ss direction. Positive indicates compression on local rr column face.
-
Torsion: Displays frame element results for column torsion about Global Z direction.
|
| Individual Column Design Results |
Lists selection options for column code check results. This should only be viewed after the Code Check Columns function has been performed from the Column Design ribbon.
-
Status: Displays the code check status of columns. Includes NA (has not been performed or column is not assigned to group), Acceptable, Warning (result violates code requirement), Borderline (within 10% utilization) and Unacceptable (Utilization greater than user-input value).
-
V&T Utilization: Displays shear and torsion utilization as NA, Acceptable or Unacceptable. Value indicates interaction value for the column.
-
NvsM Utilization: Displays axial and moment utilization as NA, Acceptable or Unacceptable. Value indicates interaction value for the column.
-
Design Loads: Displays the column forces and moments for the code check producing the greatest utilization values.
-
Axial Capacity: Displays the maximum column axial capacity for the selected design code.
|
| Design Group Results |
Lists selection options for column design group results. This should only be viewed after the Design Columns function has been performed from the Column Design ribbon.
-
Status: Displays the design status of columns related to the controlling condition for the overall design group. Includes NA (has not been performed or column is not assigned to group), Acceptable, Warning (result violates code requirement), Borderline (within 10% utilization) and Unacceptable (Utilization greater than user-input value).
-
V&T Utilization: Displays shear and torsion utilization as NA, Acceptable or Unacceptable. Value indicates controlling interaction value for the design group.
-
NvsM Utilization: Displays axial and moment utilization as NA, Acceptable or Unacceptable. Value indicates controlling interaction value for the design group.
-
Rho: Displays the ratio of area of reinforcement to the gross area of column section for the design group.
-
Design Group: Displays the name of design group assigned to the column.
|
|
|
Beam
|
Lists selection options for beam graphical results display.
| Deformation |
Lists selection options for column element deformation results display.
-
rr-Translation: Displays frame element results for beam deformation in local rr direction. Positive follows local rr axis orientation.
-
ss-Translation: Displays frame element results for beam deformation in local ss direction. Positive follows local ss axis orientation.
-
Z-Translation: Displays frame element results for beam deformation in global Z direction. Positive follows global axis orientation.
-
Global-Translation: Displays beam frame element results for combined global deformation.
|
Actions
(Diagram) |
Lists selection options for beam frame element actions for selected load combination or envelope.
-
Axial Force: Displays frame element results for beam axial force in along local rr direction. Positive indicates tension.
-
Shear Along ss: Displays frame element results for beam shear force in local ss direction (in-plane).
-
Shear Along zz: Displays frame element results for beam shear force in local zz direction (normal).
-
Moment about ss: Displays frame element results for beam moment about local ss direction. Positive indicates compression on global Z face.
-
Moment about zz: Displays frame element results for beam moment about global Z direction. Positive indicates compression on local ss beam face.
-
Torsion: Displays frame element results for beam torsion about local rr direction.
-
Crack Width: Reports the crack width for beam frame elements when the analysis/design option is set to report. Only available for individual service combinations after design of sections is completed.
-
Reduced Stiffness Ratio (Ieff/Ig): Displays the ratio of Ieff to Ig for beam frame elements for cracked deflection load combinations.Only available when a cracked case of a cracked deflection combination is selected in the Loads tab.
|
|
|
Wall
|
Lists selection options for wall graphical results display.
Deformation
(Contour Map) |
Lists selection options for wall deformation contour results display.
-
rr-Translation: Displays contour results for wall deformation in local rr direction. Positive follows local rr axis orientation.
-
ss-Translation: Displays contour results for wall deformation in local ss direction. Positive follows local ss axis orientation.
-
Z-Translation: Displays contour results for wall deformation in global Z direction. Positive follows global Z axis orientation.
-
Global-Translation: Displays wall contour results for combined global deformation.
-
Drift: Displays the inter-story drift ratio relative to the reference plane height for the selected load combination and produces a graphical check for Acceptable or Unacceptable for the Drift Maximum Allowable display setting defined by you.
|
Actions
(Combination) |
Lists selection options for combined wall shell element action results for selected load combination or envelope.
-
Axial Force: Displays wall diagram results for wall axial force in global Z direction. Positive indicates tension.
-
Shear Along rr: Displays wall diagram results for wall shear force in local rr direction.
-
Shear Along ss: Displays wall diagram results for wall shear force in local ss direction.
-
Moment about rr: Displays wall diagram results for wall moment about local rr direction (weak-axis bending). Positive indicates compression on local ss wall face.
-
Moment about ss: Displays wall diagram results for wall moment about local ss direction (strong-axis bending) . Positive indicates compression on local rr wall face.
-
Torsion: Displays wall diagram results for wall torsion about Global Z direction.
|
|
Action
(Load Case(Usage: Level or Global))
|
Lists selection options for combined wall shell element action results for selected load case, usage and solution mode.
-
Axial Force: Displays wall diagram results for wall axial force in global Z direction. Positive indicates tension.
-
Shear Along rr: Displays wall diagram results for wall shear force in local rr direction.
-
Shear Along ss: Displays wall diagram results for wall shear force in local ss direction.
-
Moment about rr: Displays wall diagram results for wall moment about local rr direction (weak-axis bending). Positive indicates compression on local ss wall face.
-
Moment about ss: Displays wall diagram results for wall moment about local ss direction (strong-axis bending) . Positive indicates compression on local rr column face.
-
Torsion: Displays wall diagram results for wall torsion about Global Z direction.
|
|
Actions in local axis
(Contour)
|
Lists selection options for wall action contour results display.
-
Nrr – Axial: Displays in-plane axial force contours in local rr direction.
-
Nzz – Axial: Displays in-plane axial force contours in local zz direction.
-
Nrz – In-plane Shear: Displays rz in-plane shear contours.
-
Mrr: Displays wall moment contours for bending about local rr direction.
-
Mzz: Displays wall moment contours for bending about local zz direction.
-
Mrz: Displays wall twisting moment contours.
|
|
Stresses
(Contour)
|
Lists selection options for slab stress contour results display.
-
Mid-depth along rr: Displays centroid stress contour along local rr direction. Positive indicates tension.
-
Mid-depth along ZZ: Displays centroid stress contour along global Z direction. Positive indicates tension.
|
|
Design Section Results
|
Lists selection options for wall section code check or design results. This should only be viewed after a design or code check has been performed on the wall design sections from the Wall Design ribbon.
-
Status: Displays the code check or design status of columns. Includes NA (has not been performed or wall is not assigned to group), Acceptable, Warning (result violates code requirement), Borderline (within 10% utilization) and Unacceptable (Utilization greater than user-input value).
-
V&T Utilization: Displays shear and torsion utilization for the result set range. Values in range indicate interaction value for the wall sections.
-
NvsM Utilization: Displays axial and moment utilization for the result set range. Values in range indicate interaction value for the wall sections.
-
Panel Reinforcement: Displays wall section panel vertical and horizontal reinforcement and spacing.
-
Zone 1 Reinforcement: Displays wall zone 1 vertical bar size and quantity and tie size and spacing.
-
Zone 2 Reinforcement: Displays wall zone 2 vertical bar size and quantity and tie size and spacing.
-
Outline: Displays the generated wall section outlines at the top and bottom of walls.
|
|
|
Pier
|
Lists selection options for pier graphical results display.
Pier Actions
(Combination) |
Lists selection options for wall pier resultant actions for selected load combination or envelope.
-
Axial Force: Displays resultant wall pier axial force in global Z direction.
-
Shear Along XX: Displays resultant wall pier shear force in global X direction.
-
Shear Along ss: Displays resultant wall pier shear force in global Y direction.
-
Moment about XX: Displays resultant wall pier moment about global X direction.
-
Moment about YY: Displays resultant wall pier moment about global Y direction.
-
Torsion: Displays resultant wall pier torsion about global Z direction.
-
Display Label: Displays the pier labels on assigned piers.
|
|
|
Design Sections
|
Lists selection options for design sections graphical results display. Only available after the sections have been Designed or Investigated using the corresponding option in the Floor Design ribbon.
| Deformation |
Lists selection option for Z-translation values at design sections for selected load combination or envelope.
|
|
Actions
|
Lists selection options for design section actions for selected load combination or envelope.
-
Bending: Displays design section bending moment about axis in direction of section face. Positive produces compression on top fiber.
-
Axial: Displays design section axial force. Positive indicates compressive force.
-
Shear: Displays design section shear force normal to section face.
-
Shear in-plane: Displays design section shear force in direction of section face.
-
Bending normal-to-plane: Displays design section bending moment about axis normal to section face (global Z direction).
-
Torsion: Displays design section torsion.
|
|
Stresses
|
Lists selection options for design section stresses for selected load combination or envelope. Results only produced for service and initial combinations.
-
Top: Displays design section bending stress at the top fiber. Positive indicates tension. A green design section indicates stress does not exceed user-defined allowable tensile or compressive stress. Pink indicates the design section exceeds allowable value.
-
Bottom: Displays design section bending stress at the bottom fiber. Positive indicates tension. A green design section indicates stress does not exceed user-defined allowable tensile or compressive stress. Pink indicates the design section exceeds allowable value.
-
P/A (Precompression FEM): Displays the precompressive stress defined by axial force in the section over the gross area of the section. Negative indicates compression. A green design section indicates stress exceeds the minimum precompression defined by you in the display setting. Pink indicates minimum value is not met. Note this check is an FEM check, the program uses the nodal axial force for prestressing. This can be effected by restraint conditions as well as tendons in the opposite direction of the strip.
-
P/A (Precompression # of tendons): Displays the precompressive stress defined by total summation of tendon force intersecting in the section face over the gross area of the section. Negative indicates compression. A green design section indicates stress exceeds the minimum precompression defined by you in the display setting. Pink indicates minimum value is not met. Note this check is not affected by tendons in the opposite direction or restraint conditions of the FEM analysis.
|
|
Balanced Loading
|
Lists selection options for %balanced loading check for total dead load.
-
Balanced Loading (FEM): Displays balanced loading % (PT over total dead load) with respect to nodal uplift forces produced by all PT tendons passing through the design strip tributary for the span. A green design section indicates the minimum %balanced load is met. A pink design section indicated the balanced loading maximum percentage has been exceeded.
-
Balanced Loading (Simplified): Displays the balanced loading % (PT over total dead load) with respect to the tendon average uplift for tendons located within the design strip tributary for the span and located within the Simple load balance angle display setting relative to the support line direction defined by you. A green design section indicates the minimum %balanced load is met. A pink design section indicated the balanced loading maximum percentage has been exceeded.
|
|
Investigation
|
Lists the selection options for positive and negative moment capacity and enveloped demand graphs.
-
Moment Capacity: Displays positive (green) and negative (blue) moment graphs with capacity values and controlling demand/capacity ratios for the envelope of strength demand moments.
-
Moment Capacity with Demand: Displays positive (green) and negative (blue) moment graphs and the strength demand envelope graph (gray) with capacity and demand values and controlling demand/capacity ratios for the envelope of strength demand moments. Green indicates the demand/capacity ratio at a section is 1.0 or less. Pink indicates the demand/capacity ratio exceeds 1.0.
|
|
Reinforcement
(Longitudinal)
|
Graphical reporting options for design sections reporting the area of steel for provided and required reinforcement per program calculation and base (user-defined) reinforcement. In addition, the value of ‘rho’ is reported as the total area of steel (base + provided) divided by the section area.
-
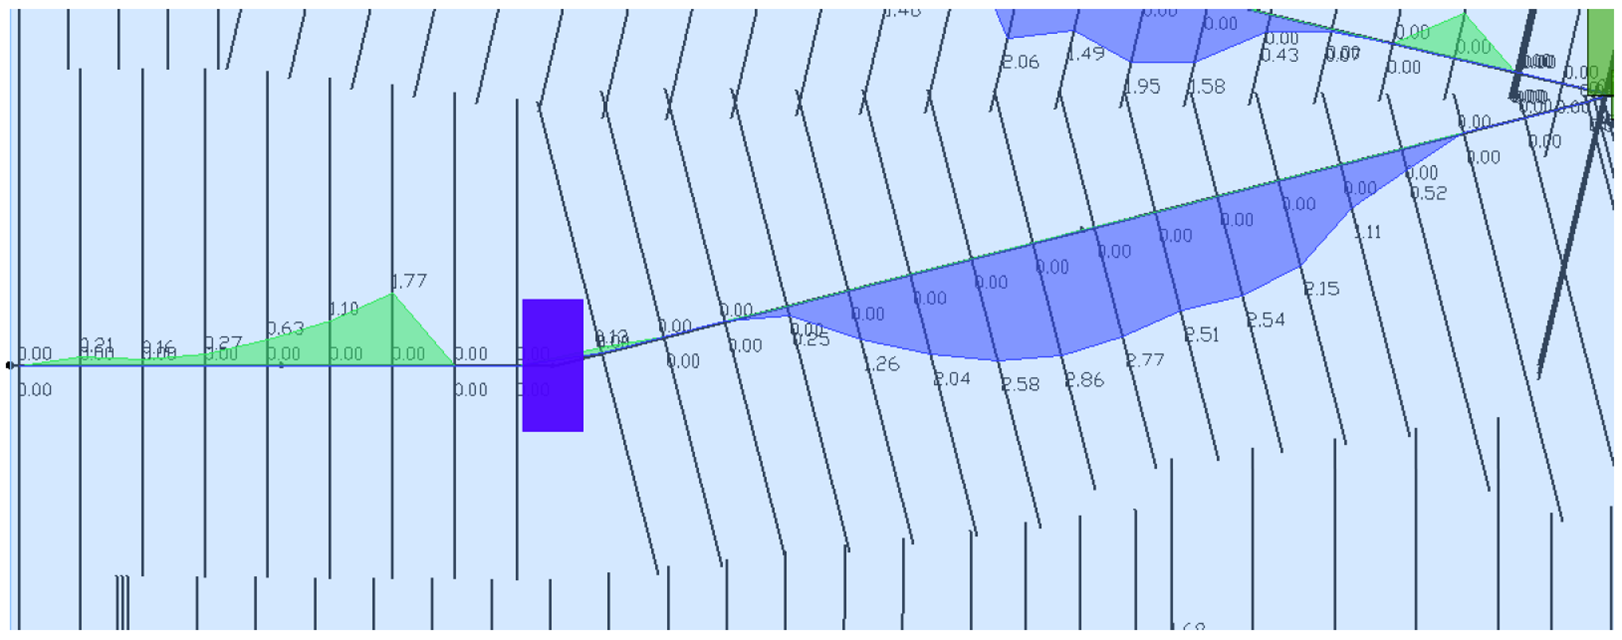
Calculated (required):Report the total reinforcement required as calculated rebar at the top and bottom of the design sections. The graphical presentation is shown for the combination or Envelope selected from ‘Loads’ tab in the Results Browser. It is not required to produce the rebar plan prior to selecting this option.
The image below shows a presentation of the output. The green graph reports the required top reinforcement, and the blue graph reports the required bottom reinforcement. The values are shown in in2 and mm2 as defaults, depending on the selected unit system.
Click on image to enlarge it
-
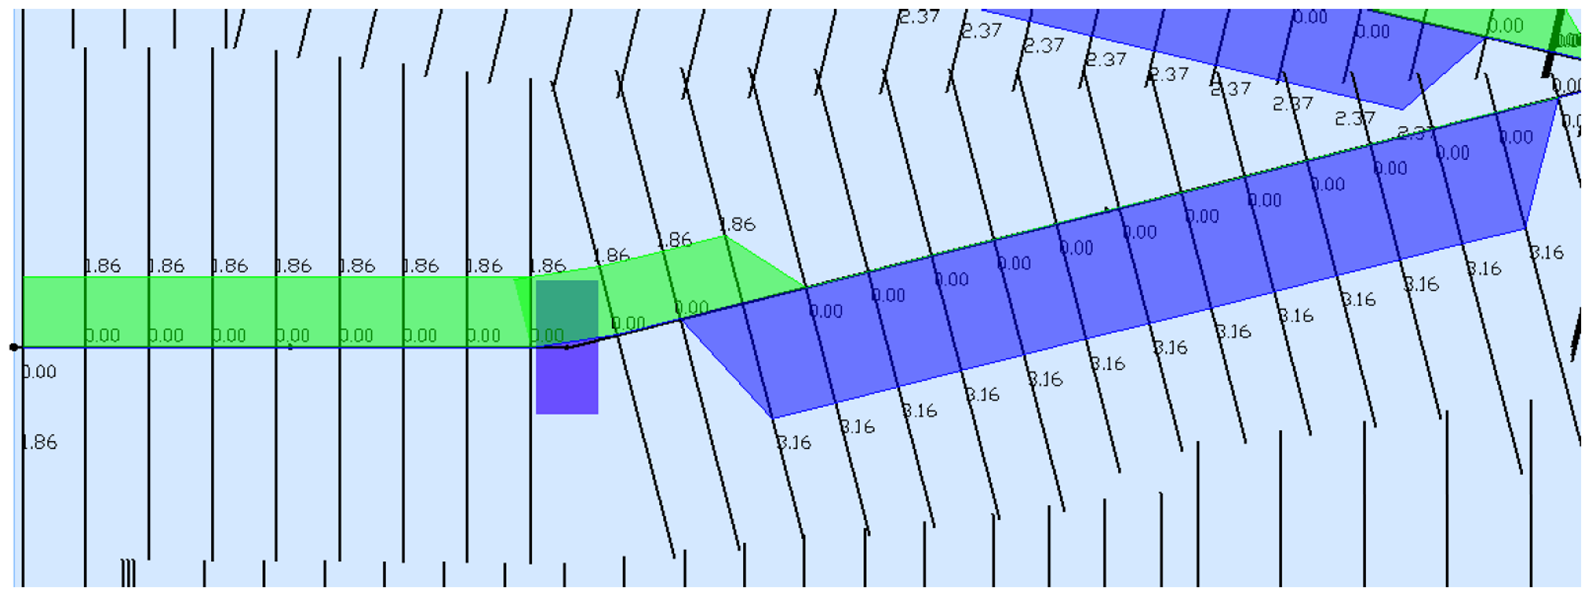
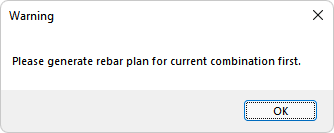
Calculated (provided): Selecting this option will report the total reinforcement provided as calculated rebar at the top and bottom of the design sections. This is a function of the user-defined bar sizes for the system criteria type for top and bottom longitudinal bars. These options can be defined from Criteria>Rebar Size/Material tab. The graphical presentation is shown for the combination or Envelope selected from the Results View>Loads tab. It is required to produce the rebar plan prior to selecting this option by going to Floor Design>Calculated Rebar Plan or Rebar>Calculated Rebar Plan icon. If the rebar plan for the selected load combination or envelope type has not been produced, a warning will appear as shown below.
The image below shows a presentation of the output. The green graph reports the provided top reinforcement and the blue graph reports the provided bottom reinforcement. The values are shown in in2 and mm2 as defaults, depending on the selected unit system.
Click on image to enlarge it
-
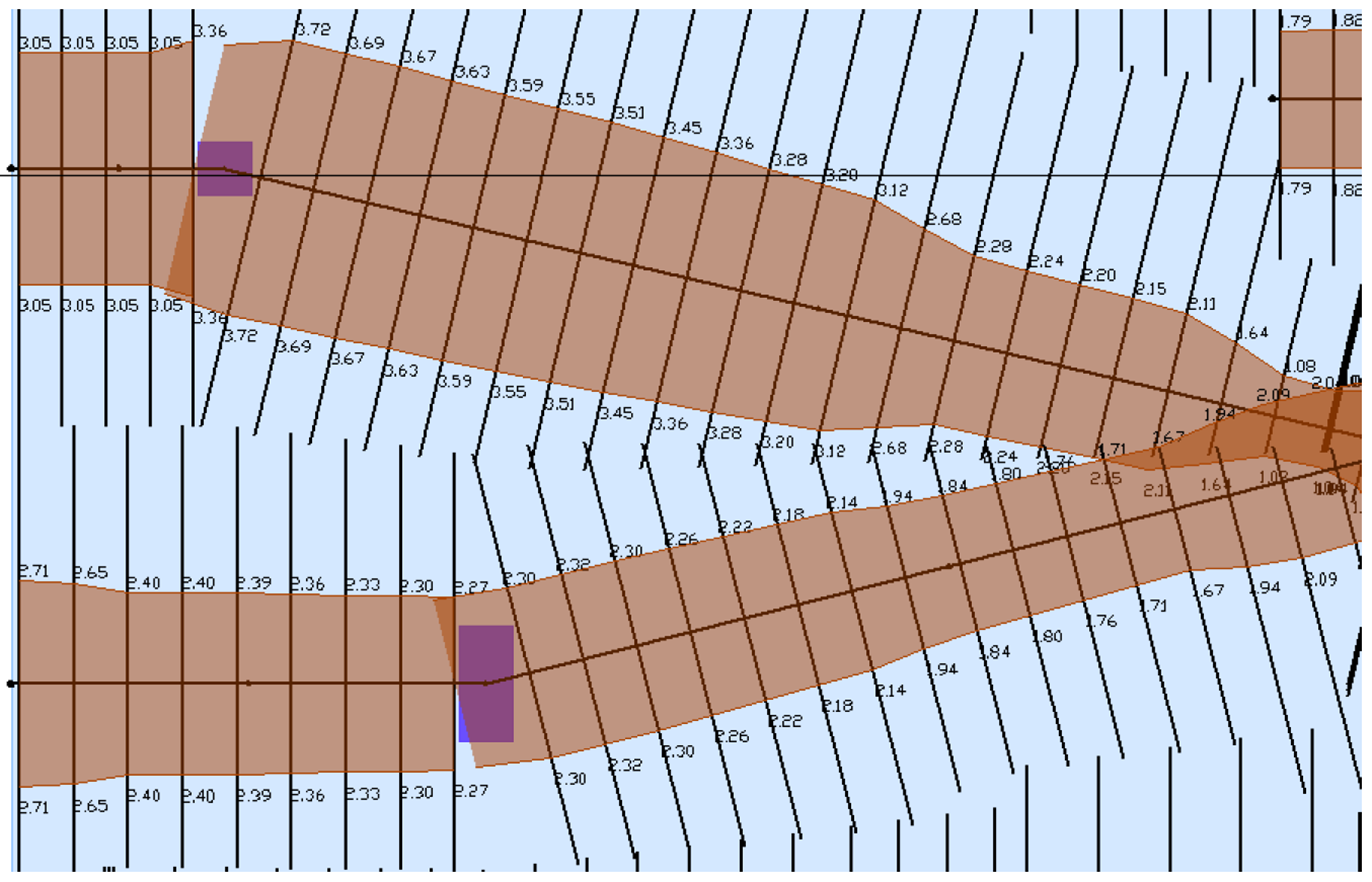
Base: Selecting this option will report the total base (user-defined) reinforcement modeled in the slab and/or beam at the top and bottom of the design sections. The user must Design or Investigate the sections prior to producing the result. The graphical presentation is shown for the combination or Envelope selected from the Results View>Loads tab.
The image below shows a presentation of the output. Both top and bottom graphs are reported as orange. The values are shown in in2 and mm2 as defaults, depending on the selected unit system.
Click on image to enlarge it
-
Rho: Selecting this option will report total area of base rebar plus calculated required rebar for the selected load combination, divided by the total area of the design section. Prestressing steel area is not included in this calculation. The user must Design or Investigate the sections prior to producing the result. The graphical presentation is shown for the combination or Envelope selected from the Results View>Loads tab. The value presented is shown as %.
Click on image to enlarge it
|
|
Contribution of prestressing to moment capacity of beams
|
Lists selection options for the graphical check of positive and negative bending capacity derived from PT. Only produces a result when the option is selected in Criteria-Analysis/design options.
-
Positive: Indicates the ratio of positive capacity derived from PT cables/total positive capacity. Green indicates the ratio is less than or equal to the setting from Criteria-Analysis/design options defined by you. Pink indicates the ratio exceeds the limit defined by you.
-
Negative: Indicates the ratio of negative capacity derived from PT cables/total negative capacity. Green indicates the ratio is less than or equal to the setting from Criteria-Analysis/design options defined by you. Pink indicates the ratio exceeds the limit defined by you.
|
|
Design Criteria
|
Displays the design criteria the design section is set for. Beam, One-Way Slab or Two-Way Slab.
|
|
One-way Shear Design
|
Lists selection options for the graphical check of one-way shear results. Only produces a result when a one-way or beam criteria support line is designed. An option for graphical representation of shear reinforcement is also included.
-
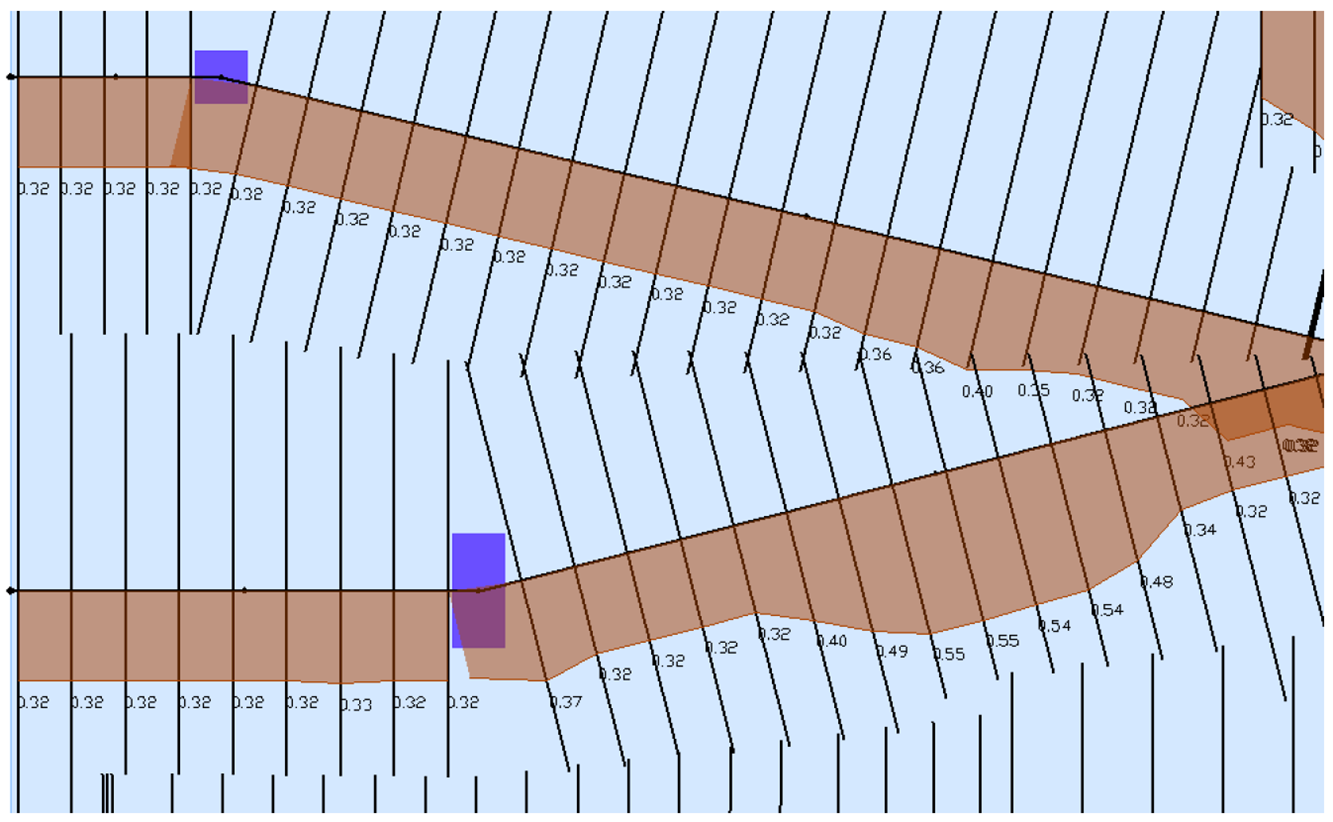
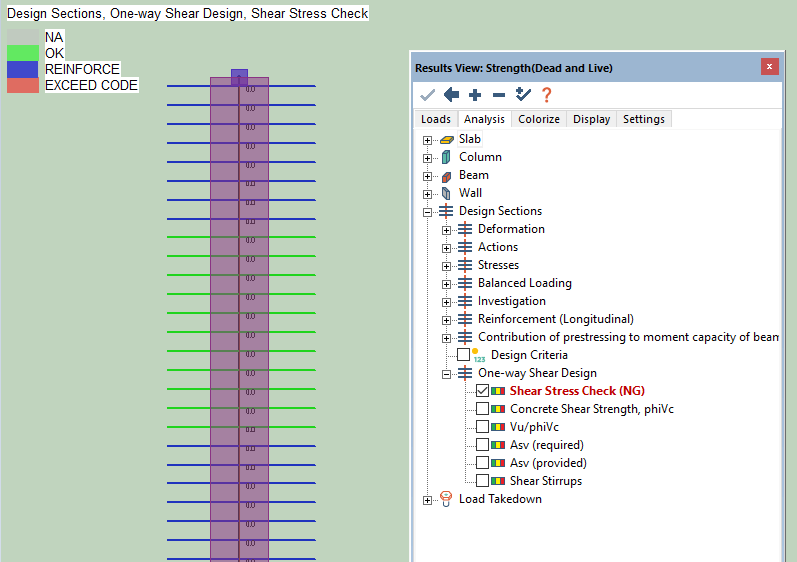
Shear Stress Check:Displays a graphical code check for each design section along a beam or one-way slab design strip for the selected strength load combination or strength envelope. The available code check status indicators are:
-
NA (Gray) – Not applicable and design section criteria is set to two-way slab.
-
OK (Green) – No reinforcement is required for the design section.
-
REINFORCE (Blue) – Reinforcement is required for the design section.
-
EXCEEDS CODE (Red) – The one-way shear stress at the section exceeds the code maximum allowable.
The image below shows an example of the result displayed along a support line.
Click on image to enlarge it
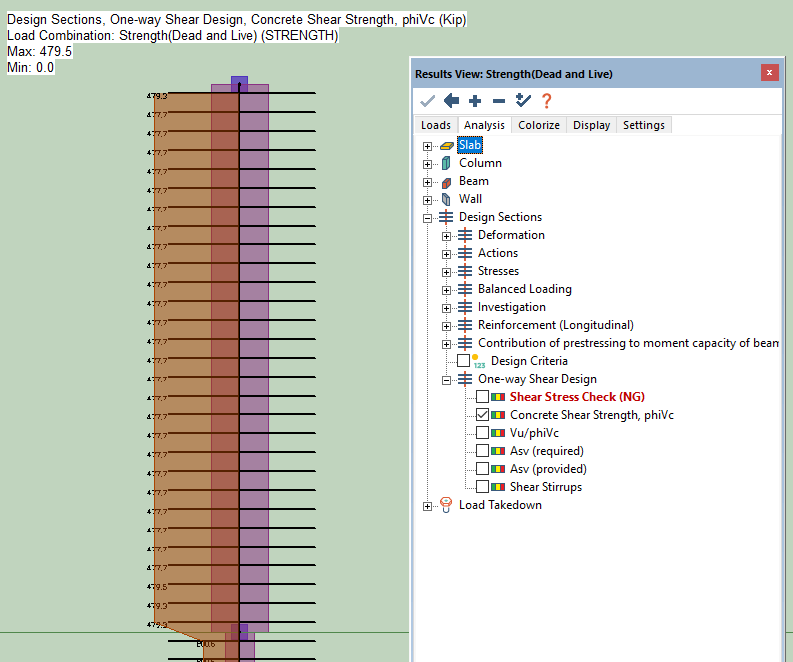
-
Concrete Shear Strength, phiVc: Reports the concrete shear capacity, phiVc (or equivalent for other non-ACI design codes) of each design section (default units of K or kN). The calculated concrete shear capacity is calculated per code requirements for RC or PT sections. Post-tensioned code expressions are used if a tendon intersects the design section.
The image below shows an example of the result displayed along a support line.
Click on image to enlarge it
To view the demand shear values, Vu, select the option from Result View>Analysis>Design Sections>Actions>Shear.
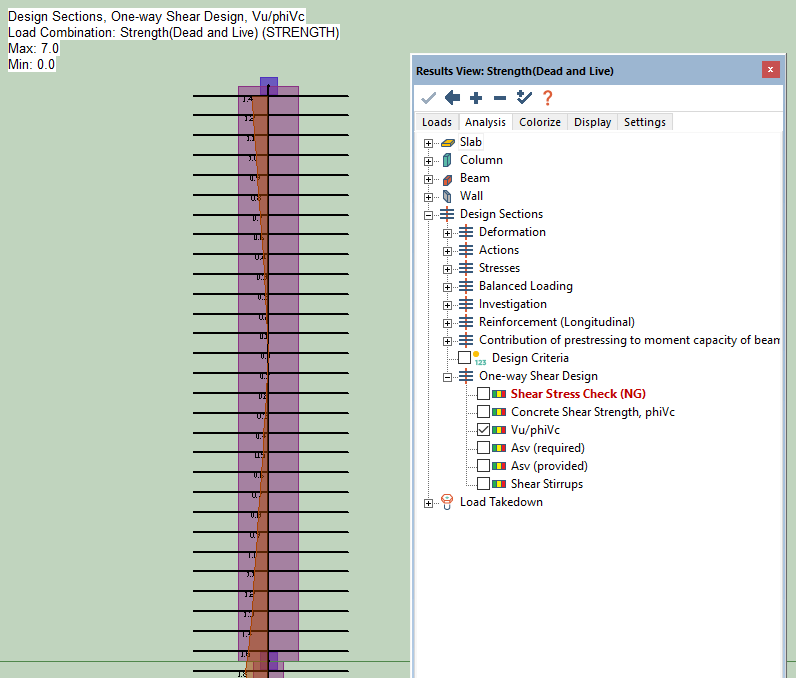
-
Vu/phiVc: Reports the demand/capacity ratio for the selected strength load combination or envelope. The capacity value is that reported as the concrete shear strength in the previous result description. Only available when viewing an individual strength combination.
The image below shows an example of the result displayed along a support line.
Click on image to enlarge it
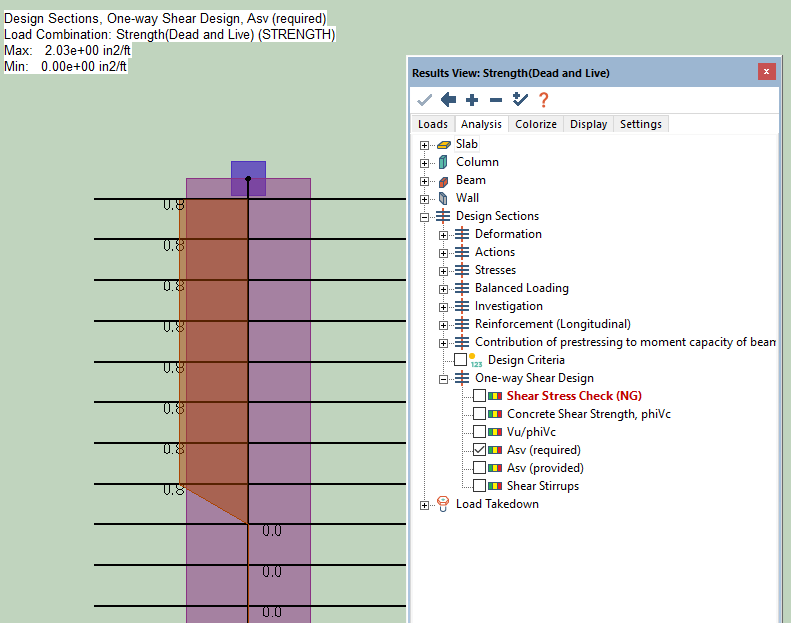
-
Asv (Required): Reports the required area of shear reinforcement per ft (US units) or per meter (SI units) based on calculation. The image below shows an example of the result displayed along a support line.
Click on image to enlarge it
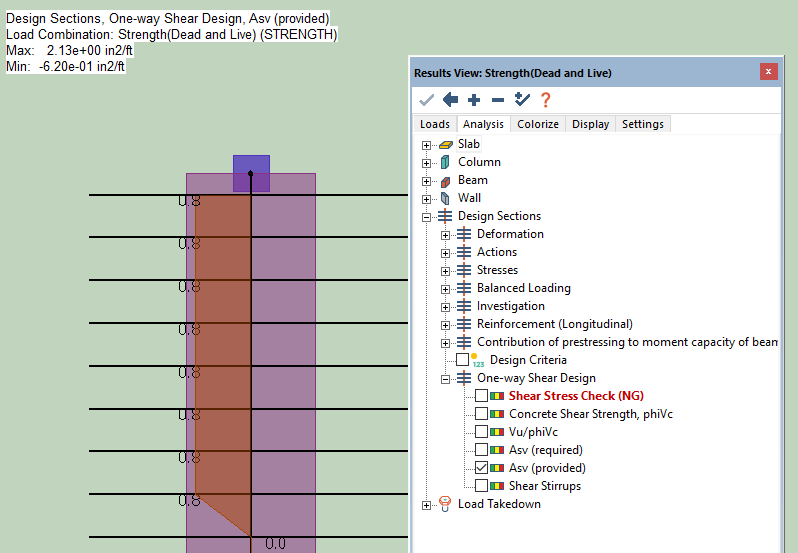
-
Asv (Provided): Reports the provided area of shear reinforcement per ft (US units) or per meter (SI units) based on input of number of legs and stirrup size selected for the design. The image below shows an example of the result displayed along a support line.
Click on image to enlarge it
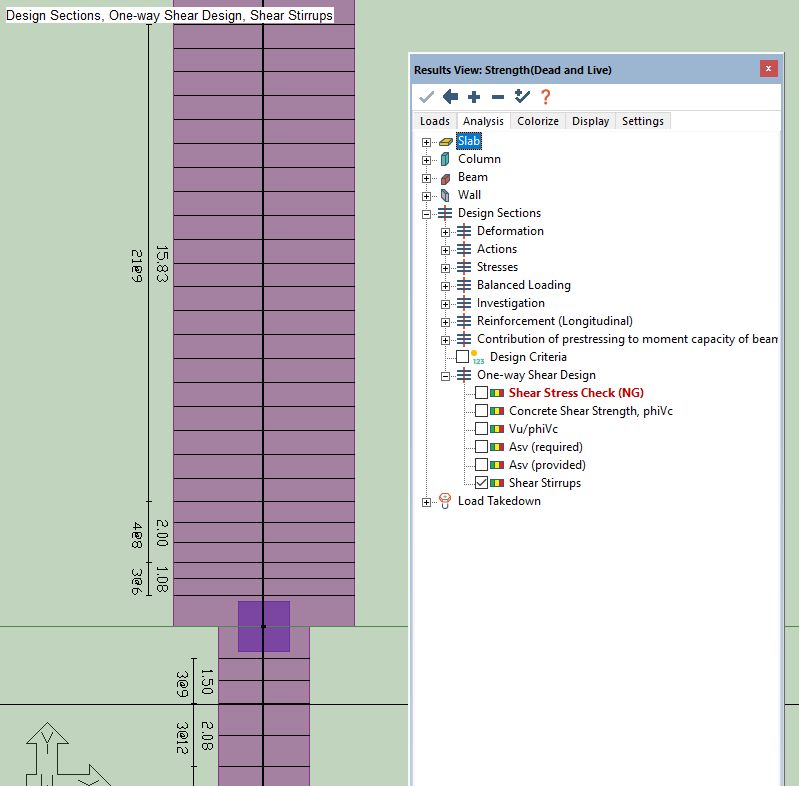
-
Shear Stirrups: Reports the number of stirrups and associated spacing in each reinforcement zone along the beam or one-way slab. The total length is given for each reinforced zone. The stirrup plan can be exported to a DWG/DXF file using the DWG/DXF export options under the File menu. The image below shows an example of the result displayed along a support line.
Click on image to enlarge it
|
|
Torsion Design
|
Lists selection options for the graphical check of torsion results. Only produces a result when a one-way or beam criteria support line is designed. Must be on the Strength Envelope or a single Strength combination of the Loads tab to activate these results.
-
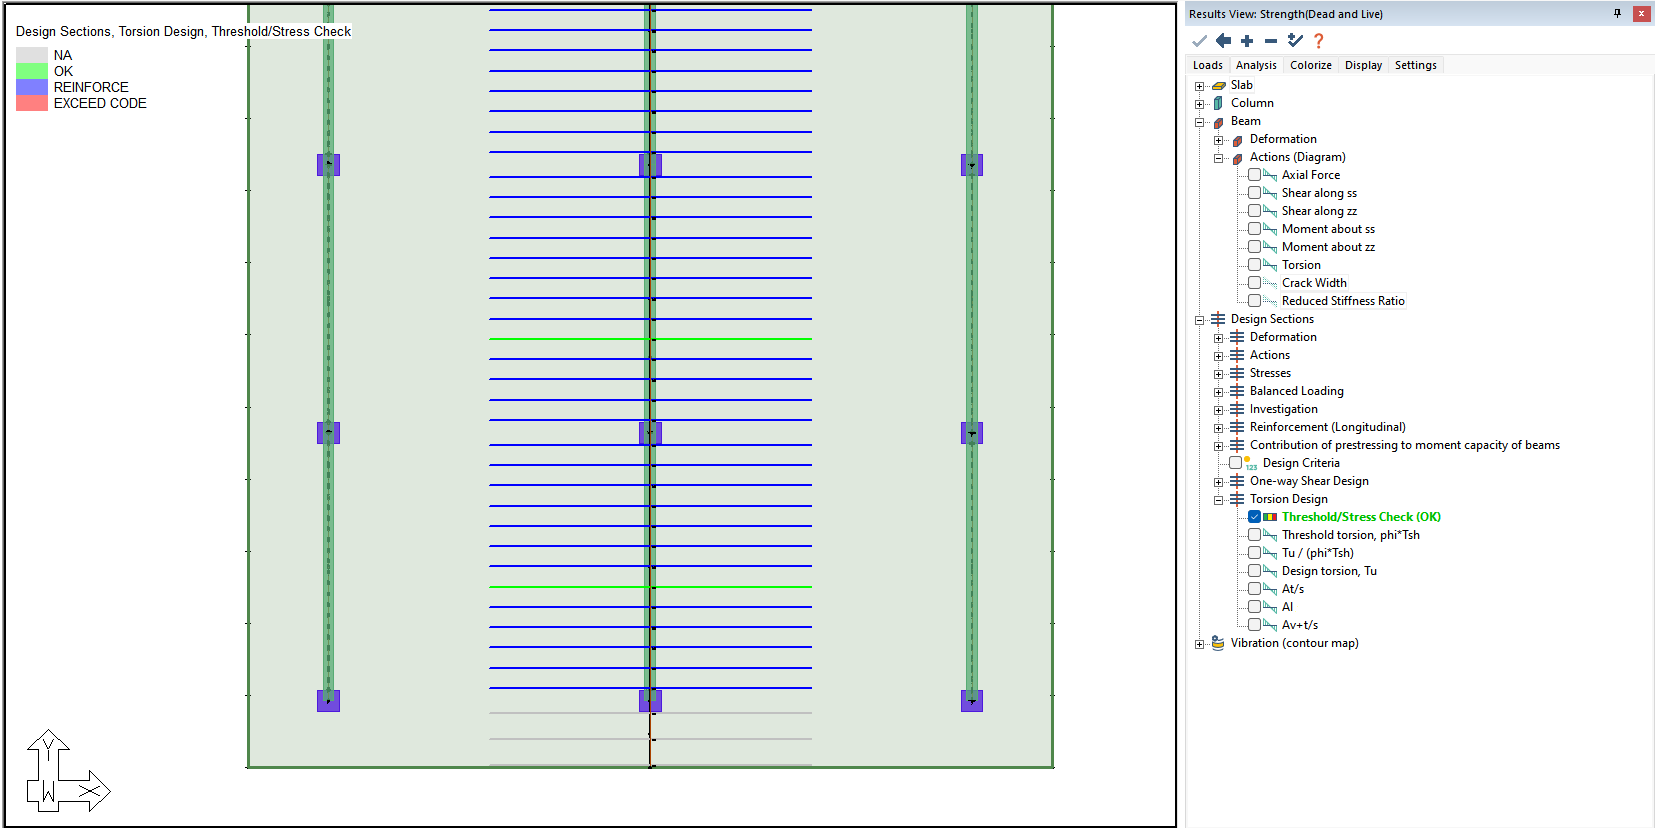
Threshold/Stress Check: Displays a graphical code check for each design section along a beam or one-way slab design strip for the selected strength load combination or strength envelope. The available code check status indicators are:
-
NA (Gray) – Not applicable and design section criteria is set to two-way slab.
-
OK (Green) –Torsional Threshold has not been exceeded, no additional reinforcement is required for the design section.
-
REINFORCE (Blue) – Torsional Threshold has been exceeded, additional reinforcement is required to satisfy the design. If Design is selected in the Criteria>Shear Design Options tab the program will calculate the additional reinforcement needed to satisfy the design.
-
EXCEEDS CODE (Red) – The torsion stress at the section exceeds the code maximum allowable. No additional reinforcement is calculated as modifications to the design must be made.
The image below shows an example of the result displayed along a support line.
Click on image to enlarge it
-
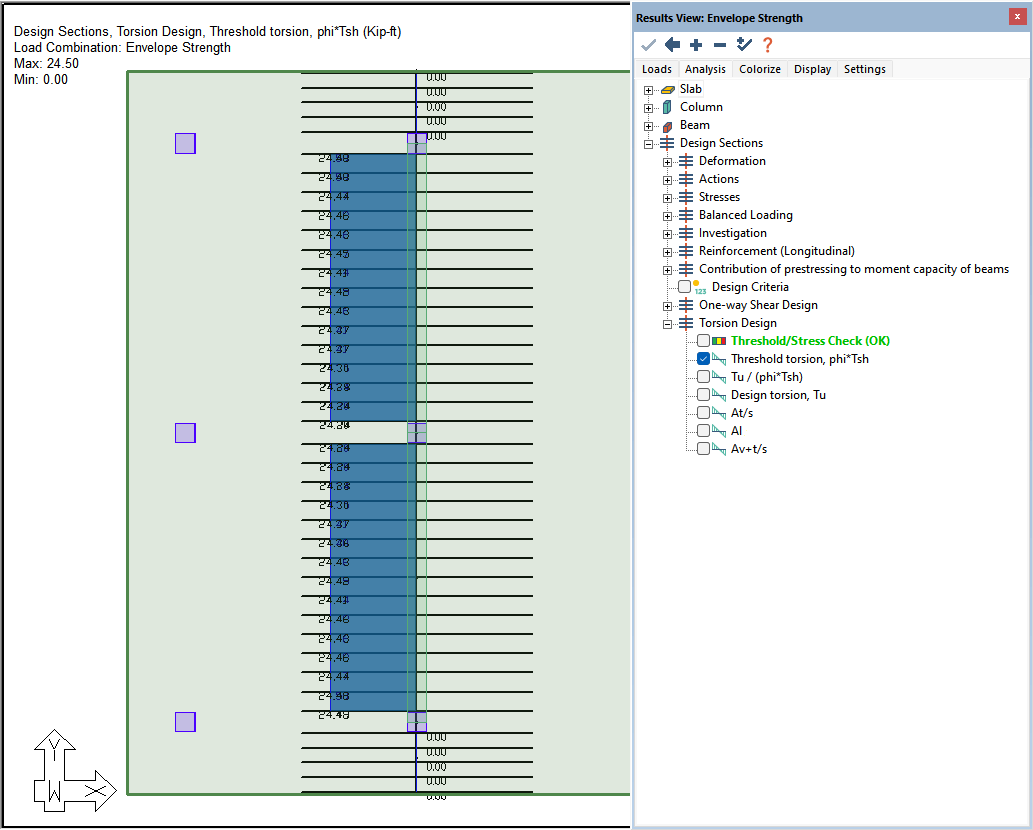
Threshold torsion, phi*Tsh: Reports the torsional threshold, phiTsh of each design section (default units of kip-ft or kN-m). The torsional threshold is calculated per code requirements for RC or PT sections (ACI318-19: Table 22.7.4.1). Post-tensioned code expressions are used if a tendon intersects the design section.
The image below shows an example of the result displayed along a support line.
Click on image to enlarge it
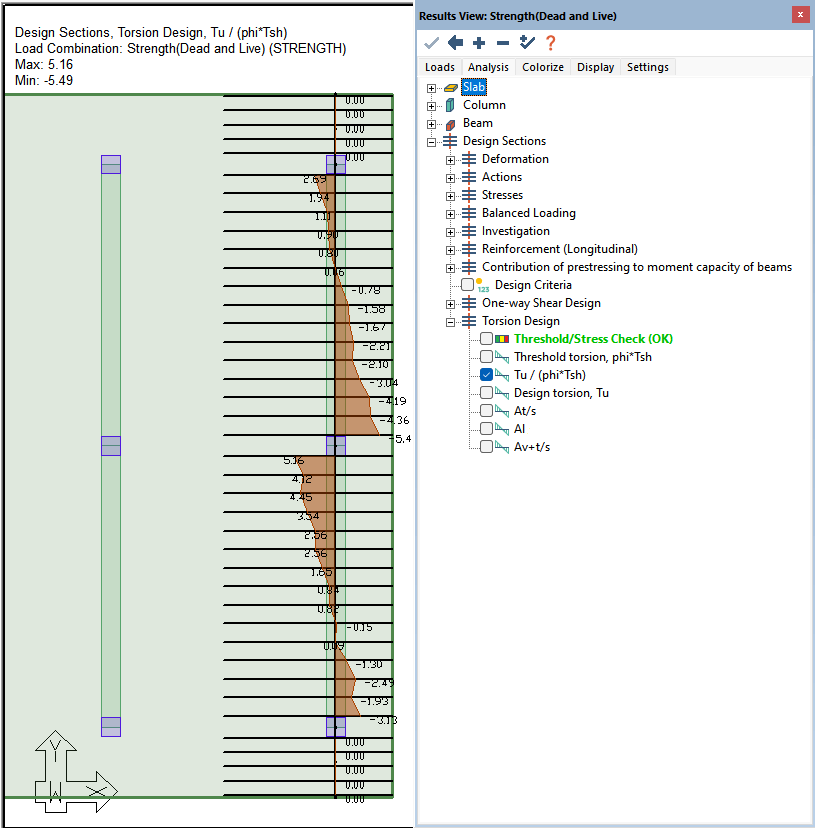
-
Tu/(phi*Tsh): Reports the ratio of the torsional moment to the factored torsional threshold.
The image below shows an example of the result displayed along a support line.
Click on image to enlarge it
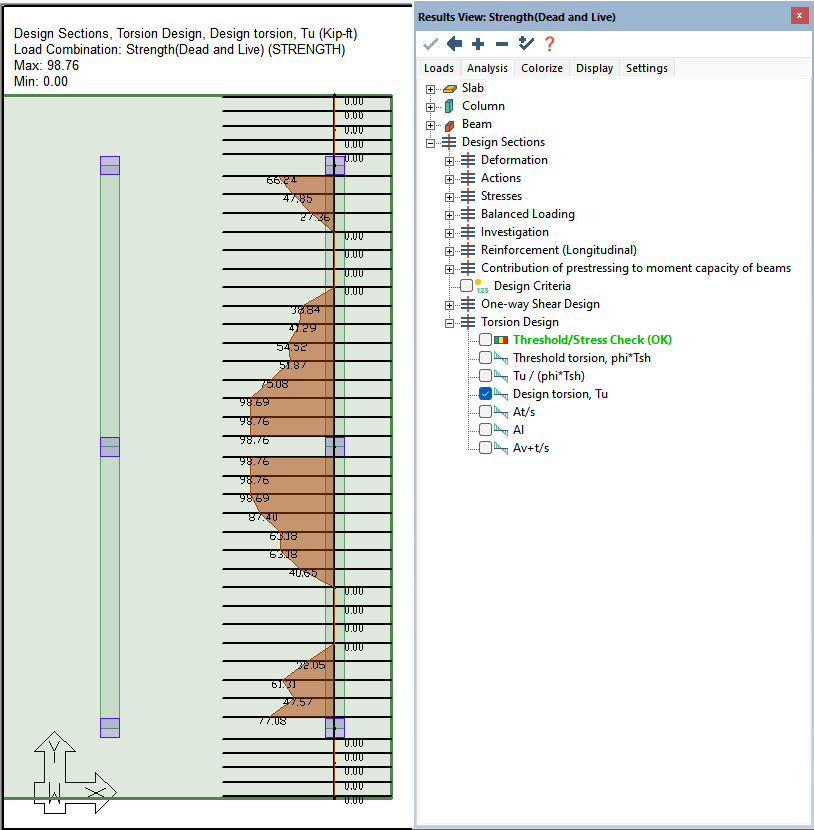
-
Design torsion, Tu: Reports the factored torsional moment (default units of kip-ft or kN-m).
The image below shows an example of the result displayed along a support line.
Click on image to enlarge it
-
At/s: Reports the required area of transverse torsional reinforcement (per 1 leg of reinforcement), required to satisfy the design of torsion for each section (default units of in2/ft or mm2/m).
The image below shows an example of the result displayed along a support line.
Click on image to enlarge it
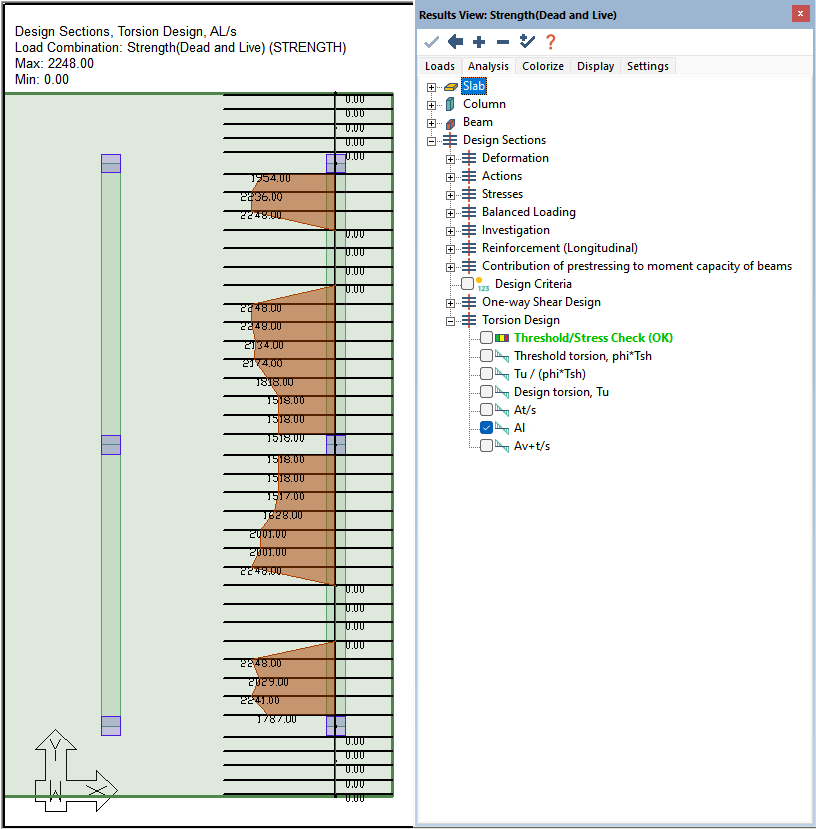
-
Al: Reports the required area of longitudinal reinforcement required to satisfy the design of torsion for each section (default units of in2 or mm2). The area of reinforcement will be distributed equally to the top and bottom of the section.
The image below shows an example of the result displayed along a support line.
Click on image to enlarge it
-
Av+t/s: Reports the total area of transverse reinforcement required to satisfy the design of one-way shear and torsion for each section (default units of in2/ft or mm2/m).
The image below shows an example of the result displayed along a support line.
Click on image to enlarge it
|
|
|
Manual Design Sections
|
Lists selection options for manual design sections graphical results display.
| Deformation |
Lists selection option for Z-translation values at manual design sections for selected load combination or envelope.
|
|
Actions
|
Lists selection options for manual design section actions for selected load combination or envelope.
-
Bending: Displays manual design section bending moment about axis in direction of section face. Positive produces compression on top fiber.
-
Axial: Displays manual design section axial force. Positive indicates compressive force.
-
Shear: Displays manual design section shear force normal to section face.
-
Shear in-plane: Displays manual design section shear force in direction of section face.
-
Bending normal-to-plane: Displays manual design section bending moment about axis normal to section face (global Z direction).
-
Torsion: Displays manual design section torsion.
|
|
Stresses
|
Lists selection options for manual design section stresses for selected load combination or envelope. Results only produced for service and initial combinations.
-
Top: Displays manual design section bending stress at the top fiber. Positive indicates tension. Agreen design section indicates stress does not exceed user-defined allowable tensile or compressive stress set in the Settings tab of the Result Display Viewer. Pink indicates the design section exceeds the allowable value set in the Settings tab of the Result Display Viewer.
-
Bottom: Displays manual design section bending stress at the bottom fiber. Positive indicates tension. A green section indicates stress does not exceed user-defined allowable tensile or compressive stress set in the Settings tab of the Result Display Viewer. Pink indicates the design section exceeds the allowable value set in the Settings tab of the Result Display Viewer.
-
P/A (Precompression FEM): Displays the precompressive stress defined by axial force in the manual section over the gross area of the section. Negative indicates compression. A green section indicates stress exceeds the minimum precompression display setting set by you. Pink indicates the design section minimum value is not met. Note this check is an FEM check, the program uses the nodal axial force for prestressing. This can be effected by restraint conditions as well as tendons in the opposite direction of the strip.
-
P/A (Precompression # of tendons): Displays the precompressive stress defined by total summation of tendon force intersecting in the section face over the gross area of the manual section. Negative indicates compression. Green indicates stress exceeds the minimum precompression display setting set by you. Pink indicates minimum value is not met. Note this check is not affected by tendons in the opposite direction or restraint conditions of the FEM analysis.
|
|
Investigation
|
Lists the selection options for positive and negative moment capacity and enveloped demand values on the manual section.
-
Moment Capacity: Displays relevant capacity (positive or negative) at the manual section and the demand/capacity ratio. A green section indicates the D/C ratio is less or equal to 1.0. Pink indicates the section ratio exceeds 1.0.
-
Moment Capacity with Demand: Displays the positive and negative capacities, demand moment values and the demand/capacity ratios at the manual section. A green section indicates the D/C ratio is less or equal to 1.0. Pink indicates the section ratio exceeds 1.0.
|
|
Contribution of prestressing to moment capacity of beams
|
Lists selection options for the graphical check of positive and negative bending capacity derived from PT. Only produces a result when the option is selected in Criteria-Analysis/design options.
-
Positive: Indicates the ratio of positive capacity derived from PT cables/total positive capacity. A green section indicates the ratio is less than or equal to the setting from Criteria-Analysis/design options set by you. Pink indicates the section ratio exceeds the limit defined by you.
-
Negative: Indicates the ratio of negative capacity derived from PT cables/total negative capacity. A green section indicates the ratio is less than or equal to the setting from Criteria-Analysis/design options defined by you. Pink indicates the section ratio exceeds the limit defined by you.
|
|
Design Criteria
|
Displays the design criteria the manual design section is set for. Beam, One-Way Slab or Two-Way Slab. |
|
|
Load Takedown
|
Lists selection options for load takedown graphical results display. Available after generating load takedown tributaries and loads from the Load Takedown icon of the Loads tab.
|
Tributary Boundary
|
Displays the tributary region in red outline for loads applied in the global Z direction for columns and walls.
|
|
Tributary Area
|
Reports the tributary area for columns and walls for the active level.
|
|
Tributary Loads
|
Reports the tributary reactions for columns and walls for loads applied in the global Z direction for the active level.
|
|
Cumulative Area
|
Reports the cumulative area for columns and walls for the active level and all levels above active.
|
|
Cumulative Loads
|
Reports the cumulative tributary reactions for columns and walls for loads applied in the global Z direction for the active level and all levels above.
|
|
FEM Global Loads
|
Reports the general load case axial forces for the multi-level solution most recently solved.
|
|
FEM Level Loads
|
Reports the general load case axial forces for the single-level solution most recently solved. If the level was not the last level analyzed these results will not be valid.
|
|
Transfer Path
|
Displays the transfer path (indicated by a red line) and % of load distributed over the path for transferred columns, walls and beams to supporting columns and walls below. Transfer path can be defined by you in the Tributary Loads window.
|
|
Load Reduction Factor
|
Displays the load reduction factor for columns and walls as calculated per user-defined cumulative areas and factors.
|
|
Compare Cumulative and FEM Global Loads
|
Displays a % difference between axial forces of the global FEM solution and the tributary load take-down calculation. Percentage difference exceeding the display setting defined by you is indicated by pink text.
|
|
|
Punching Shear
|
Lists selection options for punching shear graphical results display for the selected load combination. Only active when a strength or the strength envelope combination is selected on the Loads tab of the Results Display Viewer.
|
Punching Shear Stress
|
Displays a color-coded graphical check of the punching shear outcome. Includes NA , OK, Reinforce, or Exceeds Code. The two-way shear check will be performed for columns or walls whose thickness to width ratio is less than 4 to 1. The check will not be performed on columns or walls framed into by beams. When a column check is not performed the check will show NA for the column/wall.
|
|
Punching Shear Stress Ratio
|
Displays the controlling stress ratios for the local axes rr and ss or combined along with the associated column ID. The program will also report the governing load combination and critical section for the column.
|
|
Condition
|
Displays a color-coded graphical indication of the condition the column is checked for and the shape of the critical section used to evaluate the critical sections. Includes Corner, End/Edge, or Interior. The effective depth of the critical section is also reported graphically with this option.
|
|
Reinforcement
|
Displays a text summary of the punching shear design. The result indicates bar size used, total number of rails (rails along A column side, rails along B column side) – quantity and spacing of studs and (total rail length).
|
|
|
Vibration
(contour map)
|
Lists selection options for vibration graphical contour results display for the solved vibration combinations. You must select Include Vibration Analysis in the Analysis Options window prior to analyzing the model, for these results to become visible after analysis.
| Combination Name |
Lists the solved vibration combinations names.
-
Mode X: Displays the contour map of normalized amplitude for the selected mode and reports the frequency and period for the mode.
Note: The load combinations and number of modes listed, depends on the number of load combinations and modes entered in the Vibration Settings window of the Analysis ribbon.
-
Mass Participation: Opens the Mass Participation Factors dialog window. The table displays the frequency, period, and mass participation factors for each mode.
.
Click on image to enlarge it
|
|
|
Fiber
|
Lists selection options for Steel Fiber design parameters when the design type defined in the concrete material properties for fiber is set to mat or slab-on-grade.
| Load Regions |
Displays the edge, corner and interior regions used for the calculation of load modification factors for the non-linear analysis option of mat and slab-on-grade design types with fiber.
|
| Load Factors |
Displays the edge, corner and interior regions used for the calculation of load modification factors for the non-linear analysis option of mat and slab-on-grade design types with fiber.
|
| Maximum Joint Spacing |
Displays the maximum joint spacing value for slab-on-grade design types as calculated by the software.
|
|
Back to Results View Panel Tabs
Colorize tab
The Colorize tabbed panel sets the graphical display for colorization of Wall Design Sections and Wall property data.
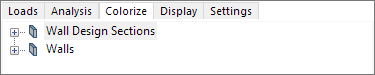
Expand the Wall Design Sections tree by clicking on the + sign next to Wall Design Sections. Expand the Walls tree by clicking on the + sign next to Walls.
Colorize Branches
|
Wall Design Sections
|
Lists selection options for colorization of wall design input properties and design parameters. For generation of wall design sections please refer to the Wall Design topic of this help file.
|
Thickness
|
Displays colorized groups for wall design sections having identical thickness.
|
|
Material
|
Displays colorized groups for wall design sections having identical material assignments.
|
|
Zone Length
|
Displays colorized groups for walls having identical zone lengths for end Zones 1 and 2.
|
|
Zone Rebar Pattern
|
Displays colorized groups for walls having identical end zone reinforcement arrangements.
|
|
Zone Rebar Pattern & Bar Size
|
Displays colorized groups for walls having identical end zone reinforcement arrangements and bar size.
|
|
Panel Rebar Pattern
|
Displays colorized groups for walls having identical wall panel reinforcement arrangements.
|
|
Panel Rebar Pattern & Bar Size
|
Displays colorized groups for walls having identical wall panel reinforcement arrangements and bar size.
|
|
|
Walls
|
Lists selection options for colorization of wall design input properties.
|
Thickness
|
Displays colorized groups for wall having identical thickness. |
|
Material
|
Displays colorized groups for walls having identical material assignments. |
|
Pier Label
|
Displays colorized groups for walls having identical pier assignments. |
|
Back to Results View Panel Tabs
Display tab
The Display tabbed panel sets the threshold values and other display settings for column and wall component code check and design graphical results.
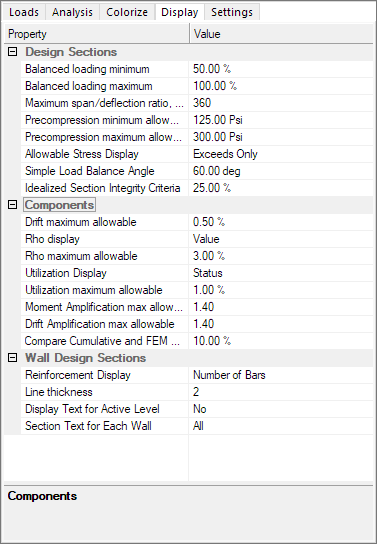
Display Categories
|
Design Sections
|
Lists design setting options for evaluation of design sections for deflection display and post-tensioned design criteria.
| Balanced loading minimum |
Sets the minimum allowed dead load balanced ratio for the graphical check. Spans with %balanced dead load less than this value will show sections as pink. Spans greater than this value will display sections as green. |
| Balanced loading maximum |
Sets the maximum allowed dead load balanced ratio for preloading the Tendon Optimizer default settings. This value is not checked graphically. |
| Maximum Span/deflection ratio |
Sets the value limit for the design strip span length over the maximum design section deflection in the span. Does not apply to cracked deflection results. The span length taken for this check is the distance between two support line verticies. |
| Precompression minimum allowable |
Sets the minimum allowed precompression for the graphical check. Design sections with precompression less than this value will appear pink. Sections greater than this value will appear green. |
| Precompression maximum allowable |
Sets the maximum allowed precompression for preloading the Tendon Optimizer default settings. This value is not checked graphically. |
| Allowable Stress Display |
Can be set to None, Exceeds Only, or All Limits. Controls display of the locations where allowable stresses exceed inputs for tension and compression or both limits for post-tensioned designs. |
| Simple Load Balance Angle |
Designates the angle between support line and tendons for consideration of the tendon in the simplified load balanced method. If the angle exceeds the input, the tendon uplift is not accounted for in the calculation. |
|
|
Components
|
Lists design setting options for evaluation of column design and graphical results display.
| Drift maximum allowable |
Sets the maximum allowable drift as a percentage of story height. If the inter-story drift over story height (%) exceeds the maximum, the columns and walls will be shown as unacceptable. Otherwise, they are displayed as being acceptable. |
| Rho display |
Sets the display type as Value or Status for % of reinforcement over cross-sectional area of the design group. Value reports % and status indicates Acceptable, Unacceptable, or NA. |
| Rho maximum allowable |
Sets the maximum allowable % for reinforcement over cross-sectional area of the column for the design group rho check. |
| Utilization Display |
Sets the display type as Value or Status for interaction utilization for column code check and design results display. Value reports % and status indicates Acceptable, Unacceptable, or NA. |
| Utilization maximum allowable |
Sets the maximum allowable % for V-T and N-M utilization for the check utilization display value check. |
| Moment amplification maximum allowable |
Sets the maximum allowable ratio for the P-Delta moment amplification graphical code check of 2nd to 1st order moments. Default set to 1.4. |
| Drift amplification maximum allowable |
Sets the maximum allowable ratio for the P-Delta drift amplification graphical code check of 2nd to 1st drift. Default set to 1.4. |
| Compare Cumulative and FEM Global Loads |
Sets the threshold % for comparing FEM and Cumulative loads. When the differential between load values exceeds the threshold, values are displayed as pink for the graphical check. |
|
|
Wall Design Sections
|
Lists section graphical display options for design and code check wall design sections.
| Reinforcement Display |
Sets the display type as Number of bars, area, rho or All for zone and panel reinforcement display of wall design sections. |
| Line thickness |
Sets the line thickness for the wall design section outline. |
| Display Text for Active Level |
Sets the display of zone and panel reinforcement of wall design sections for the active level only when set to YES. |
| Section Text for Each Wall |
Sets the display of zone and panel reinforcement of wall design sections at the top or bottom wall sections or both. |
|
Back to Results View Panel Tabs
Settings tab
The Settings tabbed panel sets the general FEM and frame element view settings for the graphical results display.
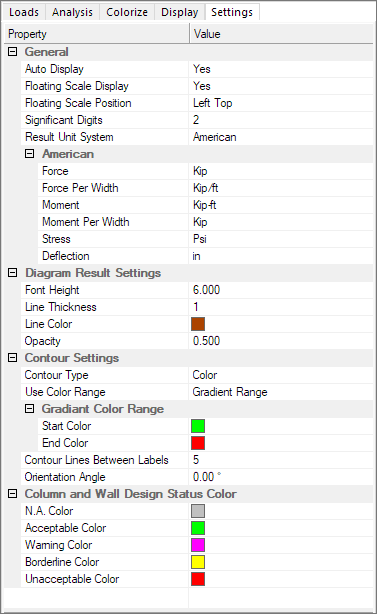
Settings Categories
| General |
Lists general graphical display, numerical precision and unit system settings.
| Auto Display |
Sets the Result Display Settings window to auto-open after analysis and section design is complete. |
| Floating Scale Display |
Sets the floating scale display for graphical results to appear when a result option is selected. |
| Floating Scale Position |
Sets the position of the floating scale in the graphical modeling window. |
| Significant Digits: |
Sets the position of the floating scale in the graphical modeling window. |
| Result Unit System |
Sets the unit system for the graphical results display.
|
Unit System
|
Reports the selected unit system.
-
Force: Force units
-
Force Per Width: Force Per Width units
-
Moment: Moment units
-
Moment per Width: Moment per Width units
-
Stress: Stress units
-
Deflection: Deflection units
|
|
|
| Diagram Result Settings |
Lists result settings for graphical results display of component and section diagrams.
| Font Height |
Sets the graphical results diagram text font height. |
| Line Thickness |
Sets the graphical results diagram line thickness. |
| Line Color |
Sets the graphical results diagram line color. |
| Opacity |
Sets the graphical results diagram fill opacity. |
|
| Contour Settings |
Lists result settings for graphical results display of slab and wall finite element contours.
| Contour Type |
Sets the contour type as a color map or line contours. |
| User Color Range |
Sets the contour map type as a gradient of two colors or user-defined color range.
Gradient Color Range
|
Gradient Color Range
|
Sets the colors for the gradient color map type.
|
|
| Contour Lines Between Labels |
Sets the frequency of contour lines displaying values. |
| Orientation Angle |
Sets the orientation angle relative to the global X-axis (deg).
|
|
| Column and Wall Design Status Color |
Sets the graphical status display colors for column and wall design result options.
| NA Color |
Sets the color for NA status. |
| Acceptable Color |
Sets the color for Acceptable status. |
| Warning Color |
Sets the color for Warning status. |
| Borderline Color |
Sets the color for Borderline status. |
| Unacceptable Color |
Sets the color for Unacceptable status. |
|
Back to Results View Panel Tabs