Status Bar
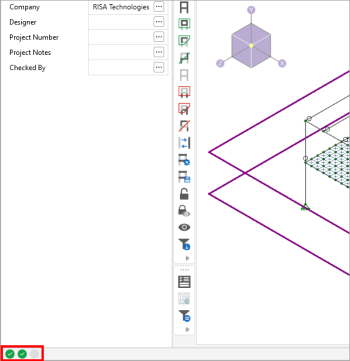
The Status Bar shows you the solution status of your model. It is comprised of three solution flags located along the very bottom of the application window, just beneath the workspace.

The first flag corresponds to a static analysis while the second flag corresponds to a dynamic analysis (eigensolution) and the third flag corresponds to a Response Spectra analysis. When the flags are gray (as shown in the image above), this means that a solution is not present. The flag turns green when a solution is present. In the following example, a static solution and eigensolution are present but a Response Spectra analysis solution is not available.
Click on image to enlarge it
When the static solution flag turns yellow, this indicates that a static solution is present however instability have been detected.

For more information on instabilities see the Stability topic.
