Pile - Results
Results for individual piles can be found in the Pile Design Results Spreadsheet, which may be accessed by clicking Results Browser from the Results toolbar and clicking Pile Design. Or, click Pile Design from the Results section of the Explorer panel.
Pile Design Checks
Click on image to enlarge it
Pile UC Checks
The Shear, Compression and Tension UC values give the ratio of demand forces to allowable forces.
- For general piles, the allowable forces are pulled directly from the Pile Definitions Spreadsheet. The UC ratios are given for the load combination that produces the worst case UC.
- For hot rolled steel, wood and concrete piles, the compressive and tensile capacities are calculated by the program based on the material, cross sectional area and design code selected in the Model Settings.
- For concrete piles, only the reinforcement is considered in the tensile capacity.
Forces
The shear, compression and tension forces are given for the load combination that produces the worst case UC.
- The program does not consider the self-weight of the piles as part of the pile's compression/tension forces. Therefore, users should account for pile self-weight by manually applying a force to account for the pile's self-weight. For piles part of a pile cap system, the user should manually apply a force on the pile cap, which then would distribute to the supporting piles. For piles supporting slabs, the pile self-weight can be applied as a point load directly on top of each respective pile.
- The shear value reported is directionless and taken as:

Gov LCs
These are the governing load combinations for each type of force which produce the highest unity check.
Soil UC Checks
The soil unity checks are the static pile capacities for tension and compression.
The Soil Comp UC is the ratio of the applied compressive force to the compressive capacity. The compressive capacity is equivalent to the sum of the skin friction at each layer and the tip bearing capacity at the layer of soil where the pile terminates. The capacity is divided by the pile factor of safety set in the Model Settings. When determining the soil compressive capacity, the program uses the following equation (Equation reference: Joseph E. Bowles, Foundation Analysis and Design, 5th Ed.):

- Qu : Ultimate pile capacity in compression
- Qp : Bearing capacity in the respective soil layer,

- Ap : Area of pile including the soil plug
- qp : Unit tip-bearing
- ∑ : Summation process over the soil layers making up the soil profile along the length of the pile shaft
- Qs : Skin Friction at each soil layer,

- p : Perimeter of pile cross section including soil plug
- ∆L: Length of pile in soil layer
- qs : Unit skin friction
- FS : Pile Factor of Safety input in the Model Settings
The Soil Tens UC is the ratio of the applied tensile force to the tensile capacity. The tensile capacity is equivalent to the weight of the pile plus the sum of the skin friction at each soil layer. The Soil Tensile UC is divided by the pile factor of safety specified in the Model Settings. When determining the soil tensile capacity, the program uses the following equation (Equation reference: Joseph E. Bowles, Foundation Analysis and Design, 5th Ed.):

- Qu : Ultimate pile capacity in tension
- W : Weight of the pile,

- g : unit weight of pile
- Ap : Area of pile
- L : Length of pile
- ∑ : Summation process over the soil layers making up the soil profile along the length of the pile shaft
- Qs : Skin Friction at each soil layer,

- p : Perimeter of pile cross section
- ∆L: Length of pile in soil layer
- qs : Unit skin friction
- FS : Pile Factor of Safety set in Model Settings
Punching Shear Values
Click on image to enlarge it
UC Check
This is the ratio of the punching shear demand to the punching shear capacity for the worst case load combination.
Gov LC
This is the load combination that produces the worst case punching shear for each individual pile.
Location
This helps to define the geometry for the shear perimeter. The program calculates a shear perimeter assuming a corner failure, an edge failure and an interior failure. The governing shear perimeter is given here.
Vuy
This is the factored punching shear demand.
Phi*Vny
This is the punching shear capacity of the slab/pile cap at this pile location. For more information on this calculation, see Pile Caps - Design.
Punching Shear Geometries
Click on image to enlarge it
Effective Depth
The effective depth, d, of the slab/pile cap is used to define the punching shear perimeter at a distance of d/2 beyond the edge of the pile.
d = tslab - pile embed - top cover - dtop bar/2
The effective depth is based on the smallest depth (to top reinforcing) for the Design Strips that encompass the pile. In cases where no design strips are defined at the pile location, the program will assume the bar size and cover specified in the first rule defined in the Design Rules Spreadsheet.
L1 and L2
Length of the critical section along the local axes. This value is used to define the punching shear perimeter. For more information, refer to the image in Using Equivalent Square Piles in the Pile Caps - Design topic.
Pile Reinforcement (Concrete)
Click on image to enlarge it
Phi Used
This value is based on the strain in the tension steel in the pile and code provisions in ACI 318-14 Section 21.2 (ACI 318-11 Section 9.3.2).
Pile Reinforcement
The Vertical Reinf and Shear Reinf values are reinforcement requirements for the pile considering spacing and minimum reinforcement requirements, per the ACI code and the Design Rules - Pedestal/ Pile tab. If these sections report "CUSTOM", it means that the user has applied a custom rebar layout.
Pile Detail Report
To see more detailed information for the pile results, select Detailed Report from the Results ribbon (when in a graphical view) and click on the node that defines the pile. The pile Detail Report shows the overall geometry, materials, codes and analysis/design inputs used for coming up with the reinforcing and code check values. The report is split into sections which include: input data/graphics, material properties, design checks and static soil capacity diagrams.
Input Data and Graphics
Click on image to enlarge it
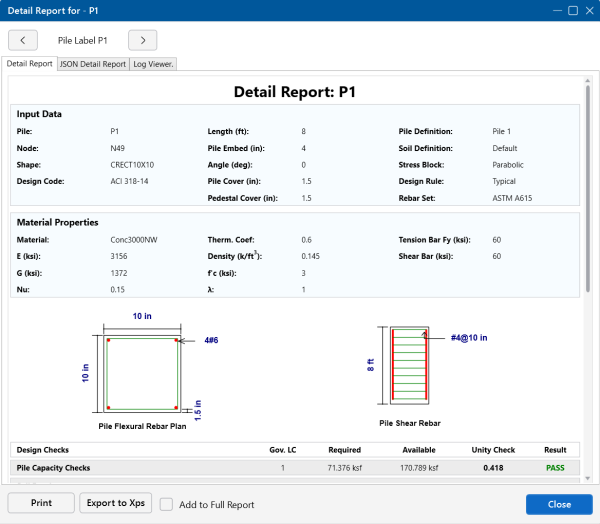
The Input Data section provides the point label of the pile and echos various input data used to define the pile element such as the pile geometry, embedment, concrete cover, pile definition label and selected rebar set.
The Material Properties section contains the material properties used for the analysis and design of the pile based on the materials specified in the Material Properties Spreadsheet.
A graphical representation of the pile geometry and reinforcement design by the program is given below the material properties section in the form of a flexural rebar plan and shear rebar elevation.
- The program bases the number and spacing of bars on the requirements per the applicable code regarding spacing and reinforcement limits.
- If a custom rebar layout is used, the program will display the reinforcement as input by the user.
Design Results

Click on image to enlarge it
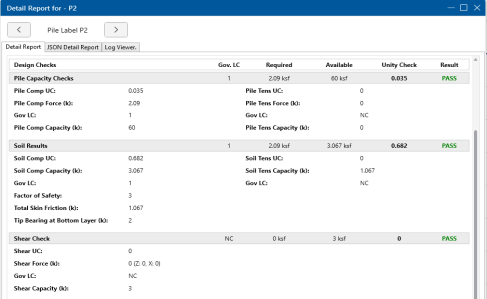
The Pile Capacity Checks summarize the code checks for the pile axial capacity based on the pile shape and material properties. Pile Comp and Pile Tens UC values give the ratio of demand forces to allowable forces.
The The Soil Results show the static pile capacities for compression and tension. This section also gives more detail about the total skin friction and tip bearing values used to calculate the capacities. The factor of safety input by the user in the Model Settings is also shown in this section of the report.
The Shear Check section shows the total shear demand and its force components in the Z and X directions. The shear capacity is a user-defined value in the Pile Definitions Spreadsheet and is compared against the demand for the unity check.
Punching Shear Check Results

Click on image to enlarge it
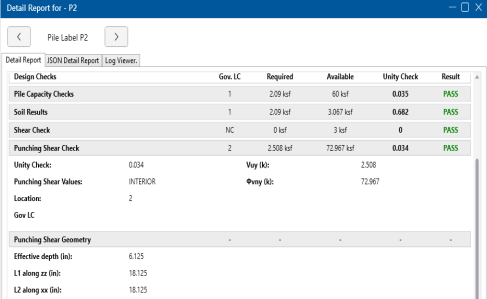
The Punching Shear Check section displays the unity check for the ratio of the punching shear demand to capacity. The governing LC is the load combination which produces the maximum unity check.
The Punching Shear Geometry section provides the dimensions used to calculate the punching shear capacity.
For an in depth explanation of the these values, see the Punching Shear Values and Punching Shear Geometries sections at the top of this topic.
Soil and Force Profile
Click on image to enlarge it
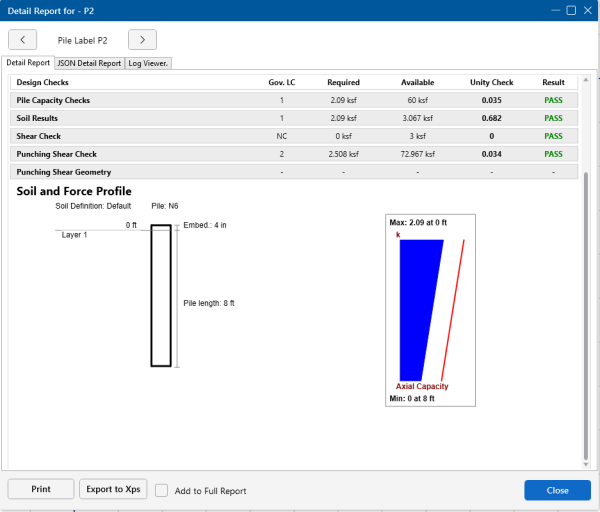
The soil profile based on the applicable soil definition is displayed on the left side of the report. The axial capacity diagram on the right side of the report shows the force demand in blue versus the static pile capacity line in red. The capacity line represents the skin friction as a function over the length of the pile. At the bottom of the pile, the tip bearing capacity is reflected by an offset. The factor of safety is considered in both the skin friction and tip bearing for the capacity line.


