Soils
Assigning Soil Properties
The default Subgrade Modulus and Allowable Bearing Pressure are entered in the Soil Definitions Spreadsheet. There is a check box in the Soil Definitions Spreadsheet to determine which soil definition will be used as the default. The default soil definition will be used for the soil properties in the whole model, except where another soil region is drawn. It is not necessary to draw a soil region for the default soil definition.
Soil Definitions Spreadsheet
The Soil Definitions Spreadsheet records the properties of each region and may be accessed by selecting Soil Definitions from the Data Entry drop-down on the Spreadsheets tab of the ribbon, or by clicking Soil Definitions from the Data Entry section of the Explorer panel. The entries are explained below.

Click on image to enlarge it
Label
You may assign a unique label to each soil definition. The soil definition with the Default box checked will be used for the soil properties in the model, except where another soil region using a different soil definition is drawn.
Layers
Soil properties may be defined for a single soil layer, or multiple layers. Clicking the (ellipsis) button in the Layers column will open the Soil Layer Profile Spreadsheet, where you can further define properties for a multi-layer soil definition. These properties are used for static pile design of Concrete, Hot Rolled Steel and Wood piles. For more information, see Soil Layer Profile.
Subgrade Modulus
The subgrade modulus is used to establish the elastic stiffness of the soil. For more information, refer to the section on automatically generating soil springs.
Allowable Bearing Pressure
Enter the gross allowable soil bearing pressure for the soil definition in this column.
Draw Soil Regions
To create a new soil region, click the Soil Regions button in the Draw Elements section of the Home ribbon.
You may apply soil properties by drawing a polygon that defines the area where these properties exist. If two regions overlap, the properties that were drawn most recently will control for the overlapping area.

Click on image to enlarge it
To Assign Soil Properties:
- If there is not a model view already open then go to the View ribbon.
- Click the Open 3D Views icon in the Window section to open a new view.
- Go to the Home ribbon.
- Click the Soil Regions icon in the Draw Elements section.
-
In the Properties panel, set the soil region properties.
- Start drawing a polygon to define the region that will be controlled by these soil properties. To indicate that you have finished drawing the region, double-click on the last node of the polygon.
- To cancel and redraw your soil region, click the right mouse button. To cancel drawing altogether, right-click the mouse button again, or press the Esc key.
To create a new soil definition, click the  (ellipsis) button next to the Soil Definition text box in the Properties panel. A Review or Change Soil Definition pop-up displays asking if you want to create a new soil definition or view and edit an existing soil definition, as shown below.

Click on image to enlarge it
Selecting Create New will open up the Soil Definition Editor dialog, where you can create a new soil definition. This dialog box can also be accessed to view existing soil definitions from the Soil Definitions Spreadsheet. In that spreadsheet, simply click on the (ellipsis) button next to the soil label and the Soil Definition Editor will open, showing the inputs for that definition.

Click on image to enlarge it
For additional advice on this topic, please see the RISA Tips & Tricks webpage at risa.com/post/support. Type in Search keywords: Varying Soil.
Soil Layer Profile Spreadsheet
The Soil Layer Profile Spreadsheet is used to define soil layers for static pile design. It is only necessary to input soil layer data when using Concrete, Hot Rolled Steel and Wood piles.

Click on image to enlarge it
To access the Soil Layer Profile Spreadsheet, open the Soil Definitions Spreadsheet and click the (ellipses) button in the Layer Cell for the soil definition you wish to edit.
The entries in the Soil Layer Profile Spreadsheet are explained below.
Label
You may assign a unique label to each layer of soil. Each label has to be unique, so if you try to enter the same label more than once, you will get an error message.
Layer Start Depth
The layer start depth is the elevation at the top of the soil layer. The first layer of soil typically has a start depth of zero. Each layer depth of soil is assumed to exist until it reaches the next layer's start depth.
Unit Weight
The unit weight represents the effective unit weight of the soil layer in lb/ft^3 or kN/m^3. The unit weight, gof a soil layer is typically determined from soil tests measuring the weight and volume of a sample. Typical values of the unit weight for various soil types could be(from Lindeberg, Civil Engineering Reference Manual, 11th ed.) :
| Soil Type | g(lb/ft^3) | gsat (lb/ft^3) |
|---|---|---|
| Sand, loose and uniform | 90 | 118 |
| Sand, dense and uniform | 109 | 130 |
| Sand, loose and well graded | 99 | 124 |
| Sand, dense and well graded | 116 | 135 |
| Glacial Clay, soft | 76 | 110 |
| Glacial Clay, stiff | 106 | 125 |
Unit Skin Friction
The unit skin friction at each layer is the theoretical unit friction resistance for that layer which can be measured in lb/ft^2 or kN/m^2. There are several methods to calculate this value depending on the engineer's judgment, type of soil and assumptions for the applicable factors. A few of these equations are listed below (Equations reference: Joseph E. Bowles, Foundation Analysis and Design, 5th Ed.):
1. The α Method: 
- α : adhesion factor
- c : average cohesion
2. The λ Method: 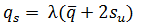
- λ : coefficient dependent on pile depth
- q ̅ : effective overburden pressure
- su : undrained shear strength
3. The β Method: 
- β : K tan δ
- K : Earth pressure coefficient
- δ : undrained friction angle
- q ̅ : effective overburden pressure
Unit Tip-Bearing
The unit tip-bearing is the unit tip or point bearing resistance for each layer of soil which can be measured in lb/ft^2 or kN/m^2. The unit tip-bearing resistance will be used to calculate the ultimate bearing capacity for a pile when the length of the bottom of the pile terminates in that layer. There are several methods to calculate this value depending on the engineer's judgment, type of soil and assumptions for the bearing capacity factors. A few equations are listed below to calculate the unit tip bearing capacity (Equations reference: Joseph E. Bowles, Foundation Analysis and Design, 5th Ed.) :
1. Unit Point Resistance: 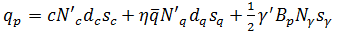
- c : Cohesion of soil beneath pile point
- Bp : width of diameter of pile point
- N'c : bearing capacity factor for cohesion
- N'q: bearing capacity factor
- N'g : bearing capacity factor for base width
2. Meyerhof’s Equation: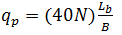
- N : statistical average standard penetration number near pile point
- Lb : pile penetration depth into point bearing stratum
- B : width of diameter of pile point
Soil Springs Calculation (Automatic)
The program uses what is commonly referred to as a Winkler foundation model. Essentially, the soil effect is concentrated at the node locations and the soil springs are based on a simple multiplication of Tributary Area of the node and the user entered subgrade modulus.
Adjusting the Subgrade Modulus
Typically, the geotechnical engineer will obtain the subgrade modulus for a 1’ by 1’ or .3m. x .3m sample plate. Typical values for various soil types could be:
| Soil Type | ks (kcf) |
|---|---|
| Loose Sand | 30 ~ 200 |
| Medium Dense Sand | 60 ~ 500 |
| Dense Sand | 220 ~ 850 |
| Clayey Medium Dense Sand | 200 ~ 500 |
| Silty Medium Dense Sand | 150 ~ 300 |
| Clayey Soil | 80 ~ 300 |
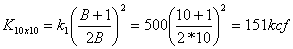
For settlement calculations, this value would need to be modified to account for our actual foundation size (e.g. 10 ft by 14 ft). For this example we will use equations from Principles of Foundation Engineering, 3rd edition, by Braja Das, pgs. 263 - 264. We will assume a 1ft x 1ft sample plate with a base ks value of 500 kcf.

These are the values that the user must enter for the subgrade modulus. The program does not automatically adjust the modulus according to the size of the foundations.
Once the user has entered in these values for the subgrade modulus, the program will automatically calculate the spring stiffness for all the joints in the model based on the tributary area of each node.
Single and Combined Footings
Since RISA optimizes footing dimensions, the final size of the spread footing is not known at the time of the FEM solution. Therefore, the program approximates the size as the average width and length in the user entered range of values.
Unlike large mat foundations, each spread footing is modeled with a single joint. Therefore, that joint needs to have a rotation spring to accurately distribute the loading for a true combined footing. RISAFoundation uses this same assumptions regarding the modulus of subgrade reaction and the dimensions of the footing when approximating these rotational springs.

Click on image to enlarge it
Grade Beams
Grade beams are also looked at as having compression only soil springs along their length. These springs will be equal to the sub-grade modulus times the width of the beam times the tributary length of the beam node.
If it is not desirable to have spring supports along the length of the beam, then a soil region with a very low sub-grade modulus can be locally defined.
Modeling Mat Foundations
Although a little out of date, the ACI publication 336.2R-88, “Suggested Analysis and Design Procedures for Combined Footing and Mats”, is a good reference for the modeling of mat foundations. For more information on these suggestions, refer to the ACI document directly.
The program uses a "Winkler Foundation" approach to the solution. As such, it does NOT explicitly take into account node coupling effects between soil springs. Therefore, it may be desired to create a "dishing" effect for the mat foundation by adjusting the subgrade modulus for different "zones" of the mat, as shown below. This procedure is described in more detail in the ACI report mentioned above.
Soil Pressure Results
RISAFoundation will automatically calculate the soil pressure profile that is induced by each one of your service level load combinations. For spread footings, these results are discussed in detail in Footing Results.
There is an Enveloped and a Batch version of the Soil Pressures Spreadsheet. Open the Enveloped version by selecting Soil Pressures from the Results section of the Explorer panel.
To access the Batch version, simply click the Batch Results button in the Enveloped Soil Pressures Spreadsheet, shown below:

Click on image to enlarge it
Envelope Soil Pressure Results Spreadsheet
The Envelope Soil Pressures Results Spreadsheet displays summaries of the soil pressure results.
The Nodal Soil Pressures tab displays the results for every node in the model. It also displays the allowable bearing pressure and the unity check for the load combination that produced the maximum unity check. If the load combination has an ABIF (allowable bearing increase factor) due to the presence of transient loads, then this will be reflected in the Allowable Bearing value listed in this spreadsheet, NOT the U/C value. Therefore, a U/C value greater than 1.0 would always indicate a soil failure. A calculated Soil Pressure of NC indicates that a soil pressure was NOT calculated for that joint. This is most likely because that node was a loading node that was not used as part for the FEM solution of a mat foundation.
The Slab, Spread Footing and Beam Soil Pressures tabs display summaries of each of the foundation elements in the model, along with the point or location that controlled the soil bearing code check for that element.
Plotting the Soil Pressure Results
The Soil Pressure results may be plotted using the options under Results View Settings - Slabs. An example of a plot showing the contoured view of the soil pressures as they exist under the slab is shown below.

Click on image to enlarge it
This view will not directly show if the soil is exceeding the allowable soil pressure. If this is desired, you can specify a custom Range of values to plot. Any values above the specified range will display in red, indicating a failure. These specific display options are discussed in more detail in Graphics - Results View Settings.
For additional advice on this topic, please see the RISA Tips & Tricks webpage at risa.com/post/support. Type in Search keywords: Soil Bearing.