You may work with the results of a solution by viewing and sorting data
in the spreadsheets, graphically plotting them with the model or by viewing
detailed
Upon the completion of a static solution, RISA opens the Results Toolbar and the Design Results Spreadsheet, and plots all the design shapes to the screen. If any warnings have been written to the Warning Log, it is displayed as well. You may then proceed to view any results and make any changes for further analysis.
If you make any changes to the model that would void the results, such
as moving
Each of the result types is described in it’s own section:
When you save a file that has been solved you may also save the results. The next time that the file is opened the saved results will be opened as well. You may use the Application Settings on the Tools Menu to change the way that you are prompted to save results.
If changes are made to the model, any saved results are deleted. Saved results for models that no longer exist in the same directory are also deleted.
You may access the result spreadsheets by selecting them from the Results Menu.
Choosing a Floor for Results
There are
You may run the solution and then graphically
select the ![]() button, the spreadsheets and printed reports will be updated so that they will only have results for the selected
items. All of the spreadsheets and reports will be controlled by
this selection and you may adjust this selection at any time.
button, the spreadsheets and printed reports will be updated so that they will only have results for the selected
items. All of the spreadsheets and reports will be controlled by
this selection and you may adjust this selection at any time.
You may also select the results of interest on each spreadsheet. While viewing spreadsheet results you may select the last line of interest and exclude the rest. Exclusions are applied independently for each results spreadsheet. Any exclusion applied to the Member Forces spreadsheet will not affect the Member Stresses spreadsheet, etc. Excluding items graphically will reset all of the spreadsheets to match the graphic selection. If you wish to combine these two features to fine tune the results perform the graphic selection first.
To exclude results click on the last line of results you wish to keep and then right click and select click the Exclude After. You can bring the results back by right clicking in the spreadsheet and selecting Unexclude.
Note
Most of the analysis results may be viewed graphically as well as in the spreadsheets. For the beams you may plot and color-code the members by bending, shear or deflection checks. See Model Display Options for more information.
To Plot Results Graphically
 button on the RISA Toolbar.
 button on
the Window Toolbar.
button on
the Window Toolbar.You will be provided with a warning if changes are made to the model
that might invalidate the current results. Should you decide to
proceed, the results will automatically be cleared and you will have to
re-solve the model to get results once you are finished making changes.
This warning may be disabled in the Application Settings
To manually clear results, click the Clear Results ![]() button.
button.
Opening a model with a solution file that was saved in a different version will also prompt you to delete the solution file in order to open the model.
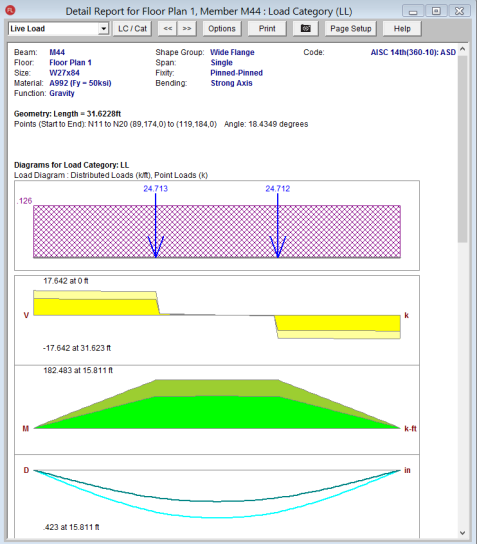
After you have performed a solution
you may view a detailed report of the beam design results. This
report contains detailed loading, force, and deflection diagrams for the
beam members. Use the  button to switch the
diagram plots from Load Categories to Load Combinations, and the drop
down menu to select the desired category or combination. The
report also contains detailed design information on the shear and moment
capacities, member deflection, end reactions, composite properties, and
floor vibration. Use the
button to switch the
diagram plots from Load Categories to Load Combinations, and the drop
down menu to select the desired category or combination. The
report also contains detailed design information on the shear and moment
capacities, member deflection, end reactions, composite properties, and
floor vibration. Use the  button to see the detail
report for the next or previous member.
button to see the detail
report for the next or previous member.
 button
on the Selection toolbar and then click on that member. If
you do not already have the model view open click the New View
button
on the Selection toolbar and then click on that member. If
you do not already have the model view open click the New View
 button on the RISA toolbar.
 button on the Window
toolbar.
button on the Window
toolbar. from the pull down list.
Note:
 - This button will allow you to take a snapshot of the current detail report you are viewing so that it can be added to a report. View the Printing topic for more information.
 The available diagrams provided are:
| Plot Designation | Plotted Value |
|---|---|
|
Load Diagram |
Applied Loads |
|
V |
Shear Force |
|
M |
Bending Moment |
|
D |
Deflection |
|
A |
Axial Force |
The load categories and load combinations that may be selected are outlined in the Loads sections of this manual. Refer to Loads - Load Types and Loads - Load Combinations for more information.
Note:
 button.
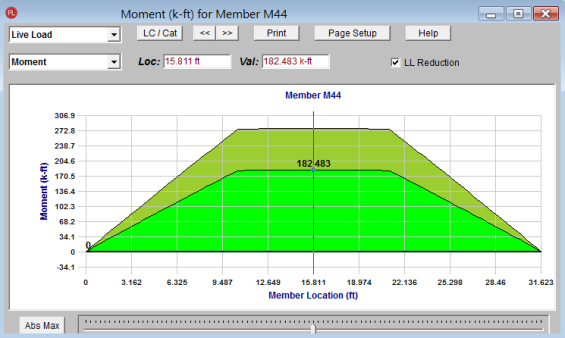
 Once a beam detail report is open, you can also click on any of the shear, moment, deflection, or axial diagrams to open an interactive diagram. Use the cursor at the bottom to drag along the length of the member to see how the value changes.
Note:
Concrete member detail reports are similar in function to detail reports for other materials, but they are different in the type and amount of information they convey. One of the largest differences is that the force diagrams are always envelope force diagrams, because the majority of the concrete design results are based on the envelope forces.
The detail reports for concrete Beams