View Vibration Analysis Results
After an analysis has been completed for a given slab, you can view vibration results in either the ADViewer or the Results View panel. The program reports the frequency (Hz), period (sec) and shows a normalized amplitude scale at the right edge of the screen. The maximum and minimum values in reference to the amplitude scale are also reported. The Mass Participation factor can be viewed per mode from the Results View panel, or in the Mass Participation Factor dialog window for all modes.
In order to obtain vibration results based on reduced stiffness due to cracking Perform a Cracked Deflection Analysis.
Note: In the case when there is more than one load combination set to “cracked deflection” the vibration analysis will be based on stiffness that is calculated for the “cracked defection” load combination that is defined last
Vibration Results – Results View Panel:
-
After Performing a Vibration Analysis the Results View panel will open on the right side of the interface.
-
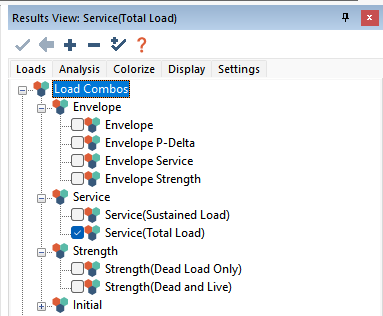
Make sure you have a single load combination selected in the Loads tab. If an envelope combination is selected the vibration results will be inaccessible. In the example below we have chosen the Service (Total Load) load combination.
Note: Vibration analysis is not dependent on the load combination you choose here. You can select a single combination just to unlock the display of the contour results.
-
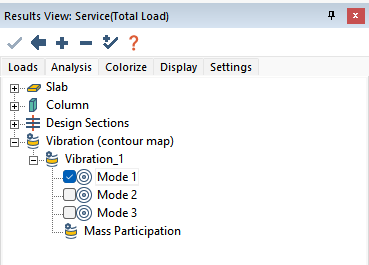
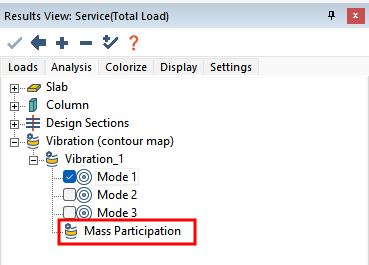
Click on the Analysis tab and expand the Vibration tree.
-
Check the box for the the Mode you want to see the analysis results for. In the above example we have chosen Mode 1.
-
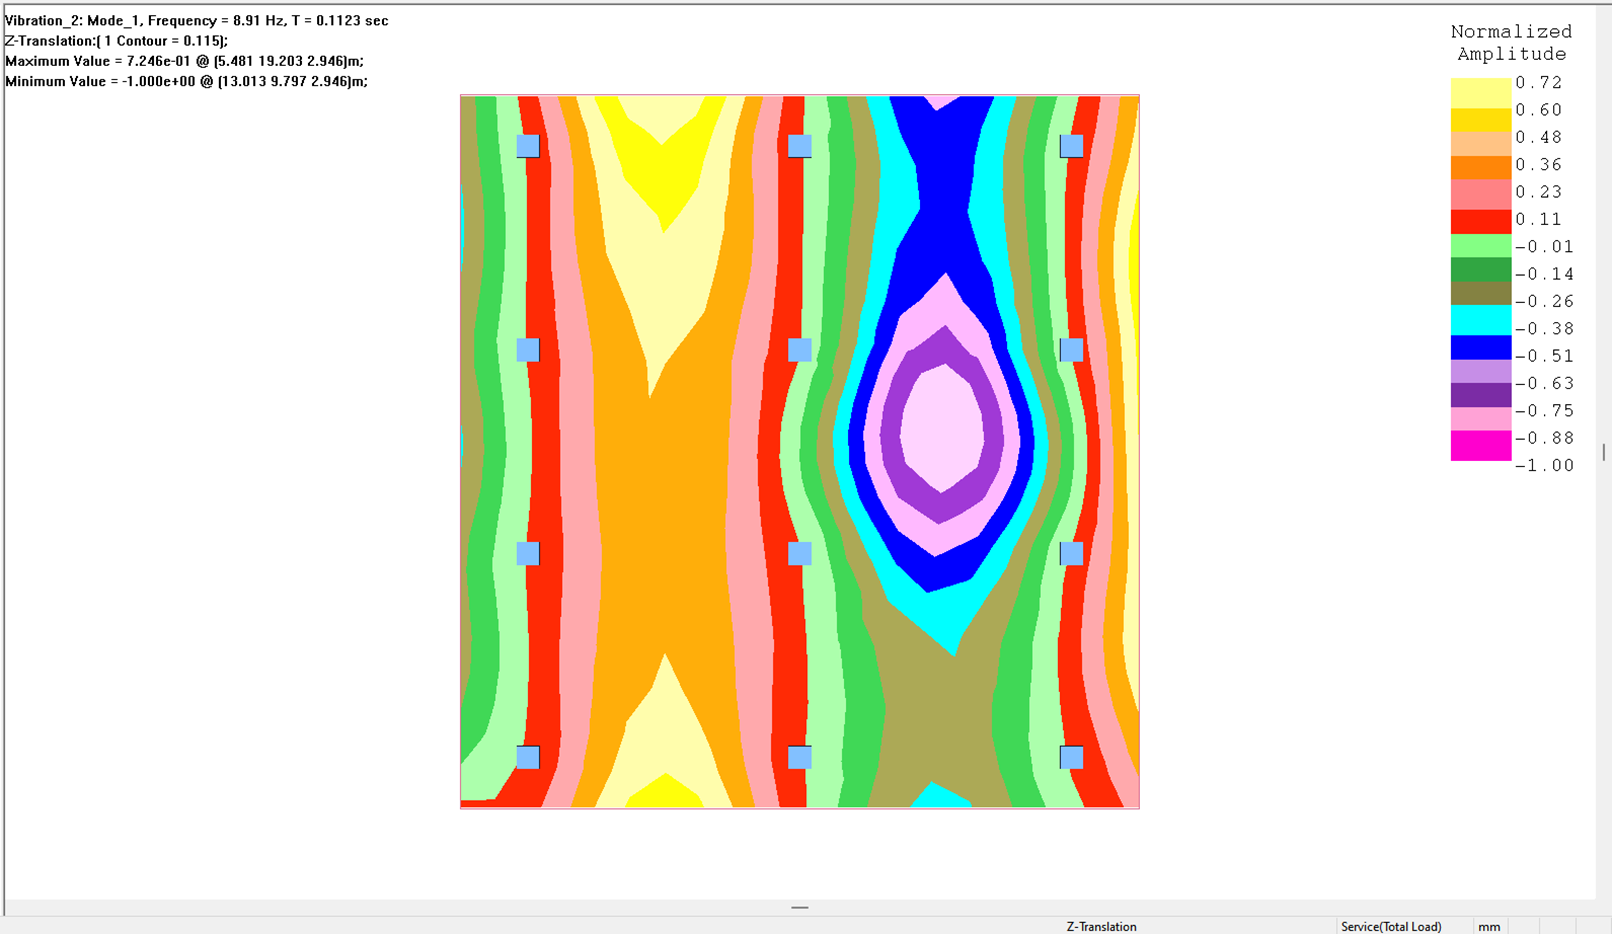
The contour will display on plan.
Click image to enlarge
-
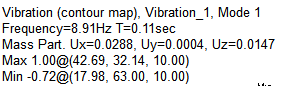
The legend will report the Frequency, Period, and Mass Participation for the selected mode.
-
The result legend scale will show the Normalized Amplitude range.

-
You can modify the results similar to Modifying the Display of Contour Results.
Vibration Results – ADViewer:
-
Perform a Vibration Analysis.
-
Go to Analysis>Analysis and click on the View Analysis Results icon to open the ADViewer
-
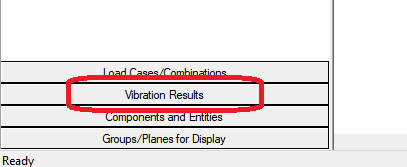
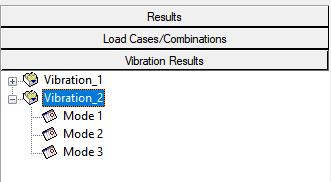
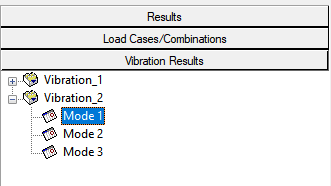
Click on the Vibration section at the bottom of the left-hand pane.
-
Expand the tree for the combination you want to view.
-
Click on the Mode you want to view the result for.
Note: Mass Participation is only shown and available from the
Results View browser.
-
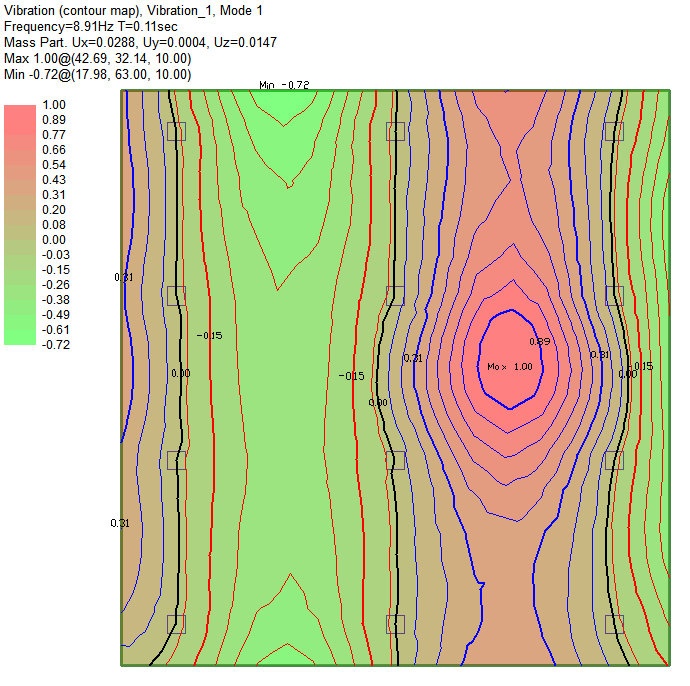
Click on the Display Results  icon to show the contours on screen. Similar to within the Results View panel, the program will report the Frequency, Period, and Normalized Amplitude range.
Click image to enlarge
-
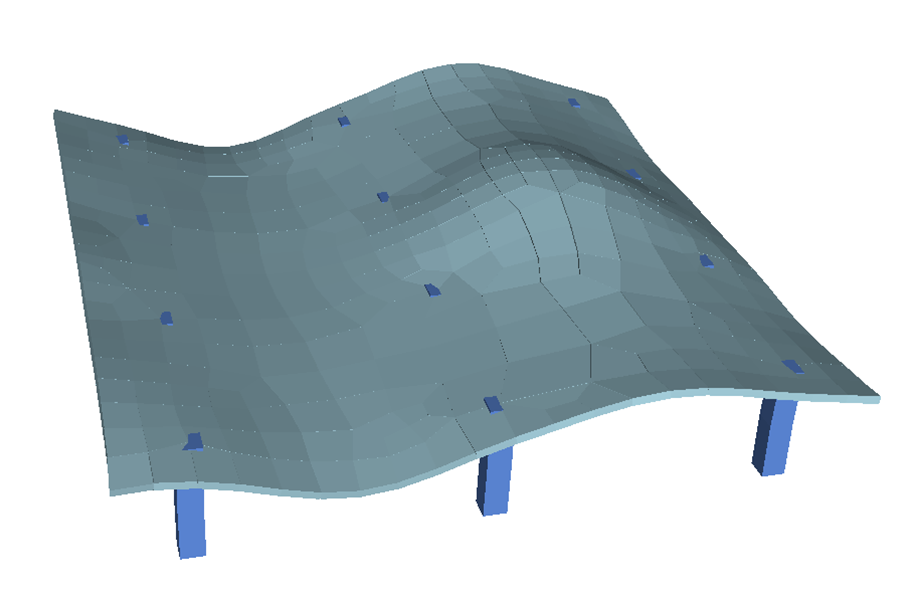
You can then click the 3D Warping  icon and rotate the view such that you can see a solid modeling view of the normalized amplitude.
Click image to enlarge
-
Click on the Animate Vibration Results  icon and the program will animate the motion of the vibration.
Vibration Results – Mass Participation Factors:
-
Click on the Analysis tab of the Results View panel and expand the Vibration tree.
-
Click on the Mass Participation result below the listed Modes to open the Mass Participation Factor window.
-
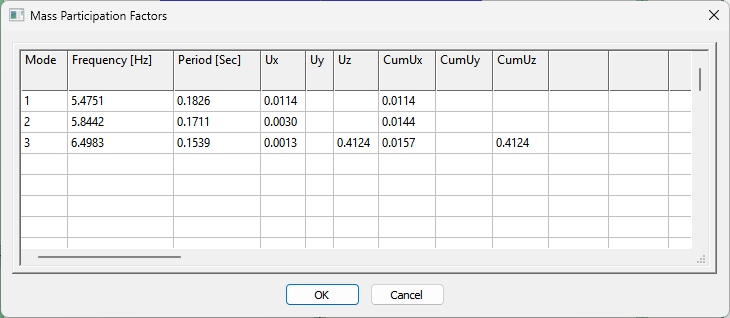
The Mass Participation Factors dialog window will open.
Click image to enlarge
-
Users can view and copy this data from the Mass Participation Factors dialog window to their own spreadsheets. The Mass Participation Factors dialog window lists the Frequency, Period, and Mass Participation factors for each Mode.