Results
You can work with the results of a solution by viewing and sorting data
in the spreadsheets, graphically plotting them with the model or by viewing
detailed
Upon the completion of a static solution, RISA opens the
If you make any changes to the model that would void the results, such
as moving
Each of the result types is described in it’s own section:
Results Spreadsheets
- Node Deflection Results
- Node Reaction Results
- Story Drift Results
- Member Force Results
- Member Stress Results
- Member Torsion Results
- Member Deflection Results
- Hot-Rolled Code Check
- Cold-Formed Code Check
- Wood Code Check
- Concrete Design Results
- Aluminum Code Check
- Concrete Wall Results
- Masonry Wall Results
- Wood Wall Results
- Plate Stress Results
- Plate Force Results
- Plate Corner Force Results
- Modal Frequency Results
- Mode Shape Results
Detail Reports
- Member Detail Reports (Hot Rolled Steel, Cold Formed Steel, & Wood)
- Concrete Beam Detail Reports
- Concrete Column Detail Reports
Save Results
When you save a file that has been solved you can also save the results. The next time that the file is opened the saved results will be opened as well. You can use the Application Settings on the Tools Menu to change the way that you are prompted to save results.
If changes are made to the model, any saved results are deleted. Saved results for models that no longer exist in the same directory are also deleted.
Results Spreadsheets
You can access the result spreadsheets by selecting them from the Results
Menu
![]()
Click on image to enlarge it
To go to a certain
item while in a spreadsheet, click the Find
To sort the
results, click on the column of results you wish to sort and then click
the Sort
Exclude Results
There are
Exclude Results Before the Solution
Excluding items before the solution, lets you remove the items from the results while leaving them as
part of the model. This exclusion is permanent for that solution
and any exclusion changes then require another solution. This
exclusion can be applied graphically
A member with an “E” in the “Inactive?” field is treated like any other member in the solution and plotting of the model, but the member is not listed in the solution results (forces, stresses, deflections, etc.). This is useful if there are certain members whose results aren't of interest. You don't have to clutter up the results with these members and can concentrate on the members you are most interested in.
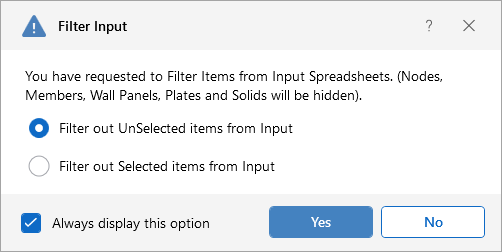
Exclude Results After the Solution
You can run the solution and then graphically select the joints, members, and plates that are of interest. By clicking the Filter Results button and in the pop-up window, you can select Filter Out UnSelected items from Results or Filter out Selected items from Results. You can then update the spreadsheets and printed reports so that they will not have results for the selected or unselected items. All of the spreadsheets and reports will be controlled by this selection and you can adjust this selection at any time.
![]()
Click on image to enlarge it
This option is also available by clicking the Filter Results button ![]() from the Results toolbar in the 3D View.
from the Results toolbar in the 3D View.
When you open any results spreadsheet, you can tell if it has been filtered by the filter icon in the spreadsheet header.
![]()
Click on image to enlarge it
Exclude Results While in Spreadsheets
You can also select the results of interest on each spreadsheet. While viewing spreadsheet results you can select the last line of interest and exclude the rest. Exclusions are applied independently for each results spreadsheet. Any exclusion applied to the Member Forces spreadsheet will not affect the Member Stresses spreadsheet, etc. Excluding items graphically will reset all of the spreadsheets to match the graphic selection. If you wish to combine these two features to fine tune the results perform the graphic selection first.
To exclude results click on the last line of results you wish to keep and then click the Ignore After button under the Spreadsheets Tab. You can bring the results back by clicking on the Show All button. Alternatively, you can select these features from the Right-Click menu in any result spreadsheets.
![]()
Click on image to enlarge it
Graphic Results
Most of the analysis results may be viewed graphically as well as in the spreadsheets. For the joints you can plot the reactions. For the members you can plot force diagrams as well as color-code the plotted members by code check or stress levels. Plate stress contours and corner forces may also be viewed graphically. Deflected shapes and mode shapes may be viewed and animated. See Model Display Options for more information.
Plot Results Graphically
To plot results graphically:
-
If you do not already have the model view open, click the Open 3D Views icon on the View ribbon.

Click on image to enlarge it
- Click the Model icon on the View ribbon for model view settings.
- Select the options you would like to view.
- Click Apply or OK.
Clear Results
You will be provided with a warning if changes are made to the model
that might invalidate the current results. Should you decide to
proceed, the results will automatically be cleared and you will have to
re-solve the model to get results once you are finished making changes.
This warning may be disabled in the Application Settings
![]()
To manually clear results, click the Clear Results icon.
![]()
Click on image to enlarge it
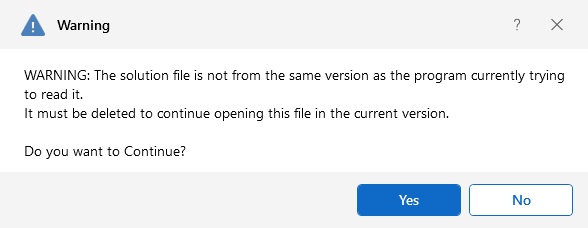
Opening a model with a solution file that was saved in a different version will also prompt you to delete the solution file in order to open the model.
Internal Force Summation Tool
This tool may be activated by clicking the icon under the Results tab. The tool is only available from within a model view that has active results for a single combination or a batch solution. This tool is not currently available for an envelope solution.
![]()
Click on image to enlarge it
This tool was originally created to convert Plate Analysis results into design forces for concrete slabs and walls. However, the tool is equally useful for structure that have beams, columns and braces. It is frequently used to determine overall story shears and moments. For detailed information on the tool, please refer to the Plate Design Tools section.
Member Detail Report
The detail report allows you to see the overall force/stress/deflection state for any particular member. This report shows diagrams for all these quantities and also lists detailed information on the code checks for Hot Rolled Steel, Cold Formed Steel, Concrete, Aluminum and Timber design.
This detail report is available for any member following the solution. If you have run an envelope solution, then you will only be able to view an enveloped detail report. If you run a Batch + Envelope solution, you can scroll between individual (Batch) load combination results, and the Enveloped results.
- If there is a (y) or (z) value next to the code check, it defines whether the controlling case is in the local y or z axes respectively.
- If there is an (s) this tells you that the maximum check occurred at some other axes where a round shape is used and the cross-sectional properties for the member are the same in all directions.
- If you are viewing an enveloped detail report, the governing load combination number will be reported in parenthesis. Ex: (LC 10).
- When a force or stress shows up with multiple colors (see image below), this signifies the difference between the total value and the value when Live Load Reduction is considered.
- The viewing of Live Load Reduction within the diagrams or the consideration of LL reduction in the reported values can be turned on or off by clicking on the
 button.
 - For members designated as beams, the Max Defl Ratio will report the maximum beam deflection ratio (L'/y') as reported in the Beam Defl tab of the Member Deflections spreadsheet.
- For members that are not designated as beams, the Max Defl Ratio will report the maximum member deflection ratio (L/y') as reported in the Service or Strength tab of the Member Deflections spreadsheet.

Click on image to enlarge it
View a Detail Report
There are three ways in which you can view a Detail Report:
-
Quick Access toolbar: Click on the Detailed Report
 button on the Quick Access toolbar and then
click on that member.
button on the Quick Access toolbar and then
click on that member. If you do not already have the model view open, click the Open 3D Views icon on the View ribbon.

Click on image to enlarge it
- Right-click menu: While viewing a member results spreadsheet, such as Member Stresses, click on the Detailed Report option from the Right-Click menu.
-
Results ribbon: Click the Detailed Report icon on the Results ribbon and then click on a member to open the report for that member.

Click on image to enlarge it
Interactive Diagrams
Once a detail report is open, you can also click on any of the force, stress, or deflection diagrams to open an interactive diagram.

Click on image to enlarge it
The diagrams provided are:
| Plot Designation | Plotted Value |
|---|---|
|
A |
Axial Force |
|
T |
Torsional Moment |
|
Vy |
Shear Force Parallel to y-y Axis |
|
Vz |
Shear Force Parallel to z-z Axis |
|
My |
Bending Moment About y-y Axis |
|
Mz |
Bending Moment About z-z Axis |
|
Dy |
Deflection in Local y Direction |
|
Dz |
Deflection in Local z Direction |
|
fa |
Axial Stress |
|
fc |
Bending Compressive Stress |
|
ft |
Bending Tension Stress |
|
f(y) and f(z) |
(Envelope Only) |
The "fa" stresses are
the stresses resulting from the axial force.
The "fc"
and "ft" stresses incorporate both
bending moment
The diagrams are scaled in groups to give a good representation of relative values. For example, the force diagrams (A, Vy and Vz) are scaled such that the force of maximum magnitude fills the diagram space. The other diagrams are then plotted using that same scale. The moments, deflections and stresses are similarly scaled together.
When an output file is saved, the program will discard much of the unneeded force, moment and deflection data used to create the detail report plots. When this saved file is later retrieved, these plots will appear more coarse and inexact. However, the maximums, minimums and controlling code checks are always maintained regardless of how coarse the plots appear.
- When a force or stress shows up with multiple colors , this signifies the difference between the total value and the value when Live Load Reduction is considered.
- The consideration of LL Reduction is only included for models that are integrated with RISAFloor.
- The consideration of LL reduction in the displayed diagram may be turned on or off by toggling the LL Reduction check box.
Detailed View for Deflection Diagrams
Only members that have been designated as beams will also report the Defl Ratio in the detailed deflection diagram. This value is the beam deflection ratio which can also be seen in the Beam Defl tab of the Member Deflections spreadsheet and the summary at the end of the Member Detail Report.
|
Beam Members
Click on image to enlarge it |
Other Members
Click on image to enlarge it |


Multi-Span Detailed View for Deflection Diagrams
For multi-span beams the detailed deflection diagram will give span information and show a dashed line at the support locations. The Defl Ratio is based on the Span Length of the current span.

Click on image to enlarge it
Tapered Members
The Detail Reports for tapered members designed to AISC Design Guide 25 contain information not available in other Hot Rolled Steel Design Reports. Refer to the Tapered Member Results sub-topic of Hot Rolled Steel Design for more information.
Envelope Member Detail Reports
The Detail Reports can be viewed for single load combinations, or as an envelope. If you solve a Batch + Envelope solution, you can toggle between the overall enveloped results and the individual load combination results using the menu at the top left.

Click on image to enlarge it
For the enveloped report, all diagrams will show enveloped data. Governing load combinations will be noted

Click on image to enlarge it
Concrete Member Detail Reports
Concrete member detail reports are similar in function to detail reports for other materials, but they are different in the type and amount of information they convey. One of the largest differences is that the force diagrams are always envelope force diagrams, because the majority of the concrete design results are based on the envelope forces.
The detail reports for concrete Beams