View Design Section Results
After designing the sections, the program stores the actions calculated for each design section. You can View Graphical Design Section Results through the Results View panel. In addition, you can View Tabular Design Section Results through the Reports ribbon Analysis Reports panel by choosing a report to view in the Design Strip drop down icon or through the Report Compiler.
ADAPT-Builder uses nodal integration to report design section actions, for both manual and automatic design sections at their centroid. Please review technical note TN302 - Evaluation of Design Values at Design Sections for more information.
View Graphical Design Section Results
Using the Results View panel you can view both Automatic Design Section Results and Manual Design Section Results. You can View Automatic Design Section Actions or View Manual Design Section Actions including in-plane and out-of-plane bending moments, in-plane and out-of-plane shear, axial force, and torsion. The program will also report deflections, stresses, balanced loading, precompression, and moment capacity for each design section. These results are required to satisfy a code requirement. You can View Automatic Design Section Code Checked Results or View Manual Design Section Code Checked Results graphically. For the results that need to satisfy a code requirement, the program will code check each section and display the design section as a continuous green line to denote that the particular result is satisfying (OK) the code requirement. If the design section fails to satisfy the code requirement, the program will display the failing design section(s) in a dashed red line denoting that the section has failed (NG) the code check. For each code checked result you can Set the Allowable Limits for Code Checked Results to be evaluated against. In addition, you can View One-way Shear Results and Two-way (Punching) Shear Results. Please see the View Two-Way (Punching) Shear Check Results topic for information on viewing punching shear results.
Set the Allowable Limits for Code Checked Results
The allowable limits for code checked items are set by the user in the Results View panel Display tab. The lone exception are the allowable stress limits, which are set in the Allowable Stresses tab of the Criteria menu. See Criteria: Allowable Stresses for setting the allowable stress limits used by the software.
To set allowable limits for code checked results:
-
Click on the Results Display Settings  icon of the Bottom Quick Access toolbar to open the Results View panel if it is not already open.
-
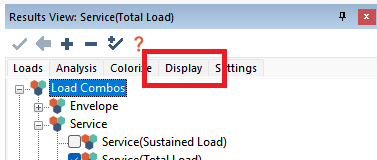
In the Results View panel that opens click on the Display tab.
-
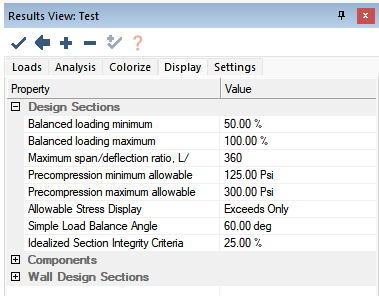
The code checked items are listed in the Design Section tree as shown below. Refer to the Results View panel Display tab topic for a description of each setting shown below.
-
Click in the Value column in the row for the limit you want to set.
-
Use your keyboard to input the value you want to set.
-
You can now view a code checked result and the sections will be displayed color coded depending on if the result passes (OK) or fails (NG) the check. An example is shown below.
Automatic Design Section Results
The below sections describe how to view Automatic Design Section Results on plan using the Results View panel. Performing a General FEM Analysis and Designing or Investigating the Design Sections must be performed before viewing the results. The below assumes this has been completed before you view the results.
To view design section actions:
-
Click on the Results Display Settings icon of the Bottom Quick Access toolbar to open the Results View panel if it is not already open.
-
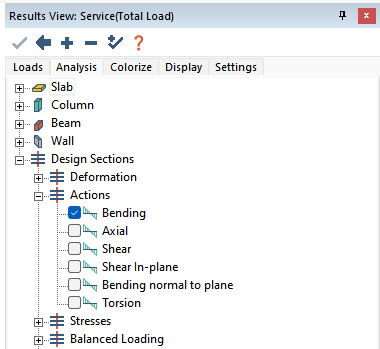
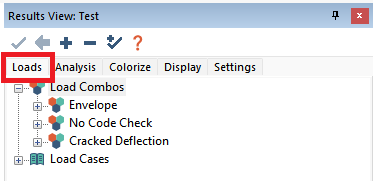
In the Results View panel that opens click on the Loads tab.
-
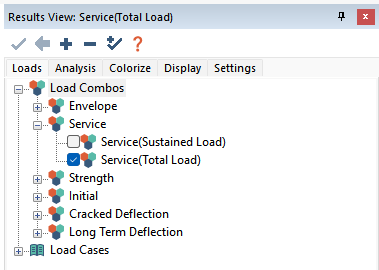
Expand the Load Combos tree and select a combination or an envelope of combinations to view the results for. In the image below we have chosen the Service (Total Load) combination.
Note: The results that can be viewed depend on the load combination chosen. Stresses and crack widths should be checked under a service combination. Two-way and one-way shear are checked under strength combinations.
-
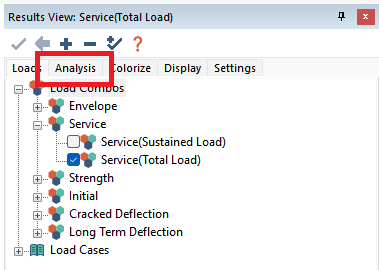
Click on the Analysis tab of the Results View panel.
-
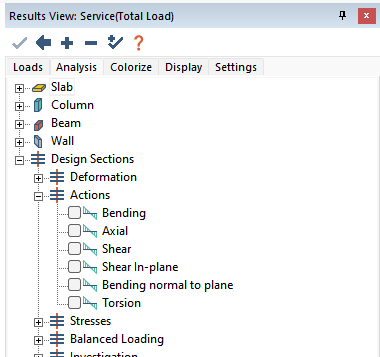
Expand the Design Sections>Actions tree.
-
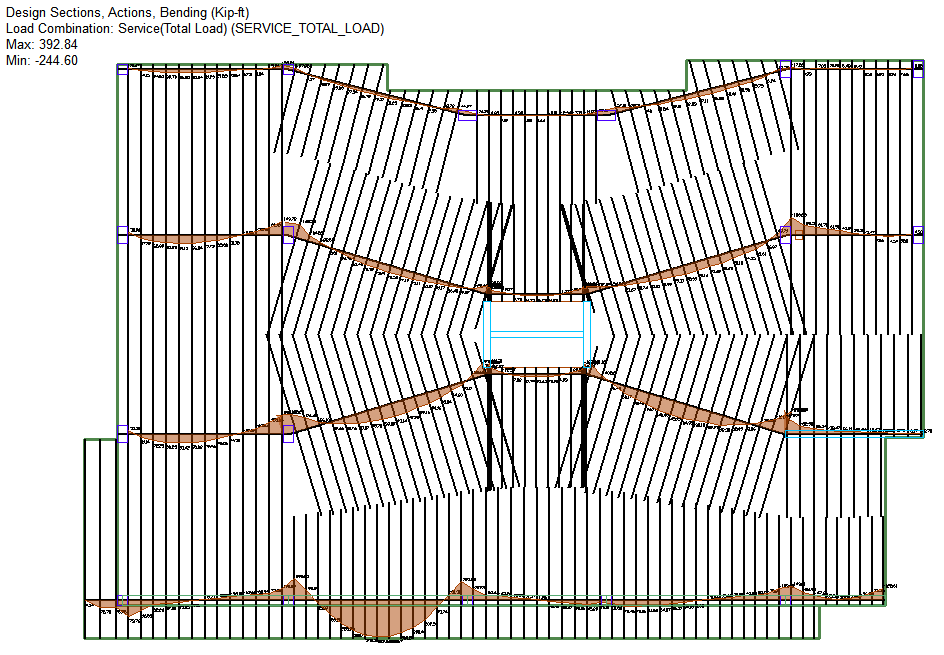
Select the action you want to view the results for. In the below example we have chosen Bending moment.
-
In the Floor Design ribbon Strip Results/Visibility panel click on the Display/Hide Support Line in X-direction  icon to turn on the support lines in the X-direction. You should see the results displayed along the X-direction support lines as shown below.
Click on image to enlarge it
-
In the Floor Design ribbon Strip Results/Visibility panel click on the Display/Hide Support Line in Y-direction icon to turn on the support lines and review the results for the Y-direction.
-
You can modify the display of the results using the tools in the Strip Reults/Visibility panel of the Floor Design ribbon and through the Settings tab of the Result View panel. Please refer to the Floor Design ribbon topic on more information on the Strip/Results Visibility tools and the Results View panel Settings tab topic for more information on the tools in the Results View panel for modifying the display of strip results.
To view code checked results:
-
Click on the Results Display Settings icon of the Bottom Quick Access toolbar to open the Results View panel if it is not already open.
-
In the Results View panel that opens click on the Loads tab.
-
Expand the Load Combos tree and select a combination or an envelope of combinations to view the results for. In the image below we have chosen the Service (Total Load) combination.
Note: The results that can be viewed depend on the load combination chosen. Stresses and crack widths should be checked under a service combination. Two-way and one-way shear are checked under strength combinations.
-
Click on the Analysis tab of the Results View panel.
-
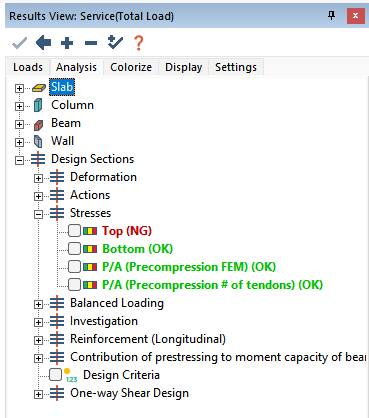
Expand the Design Sections tree.
-
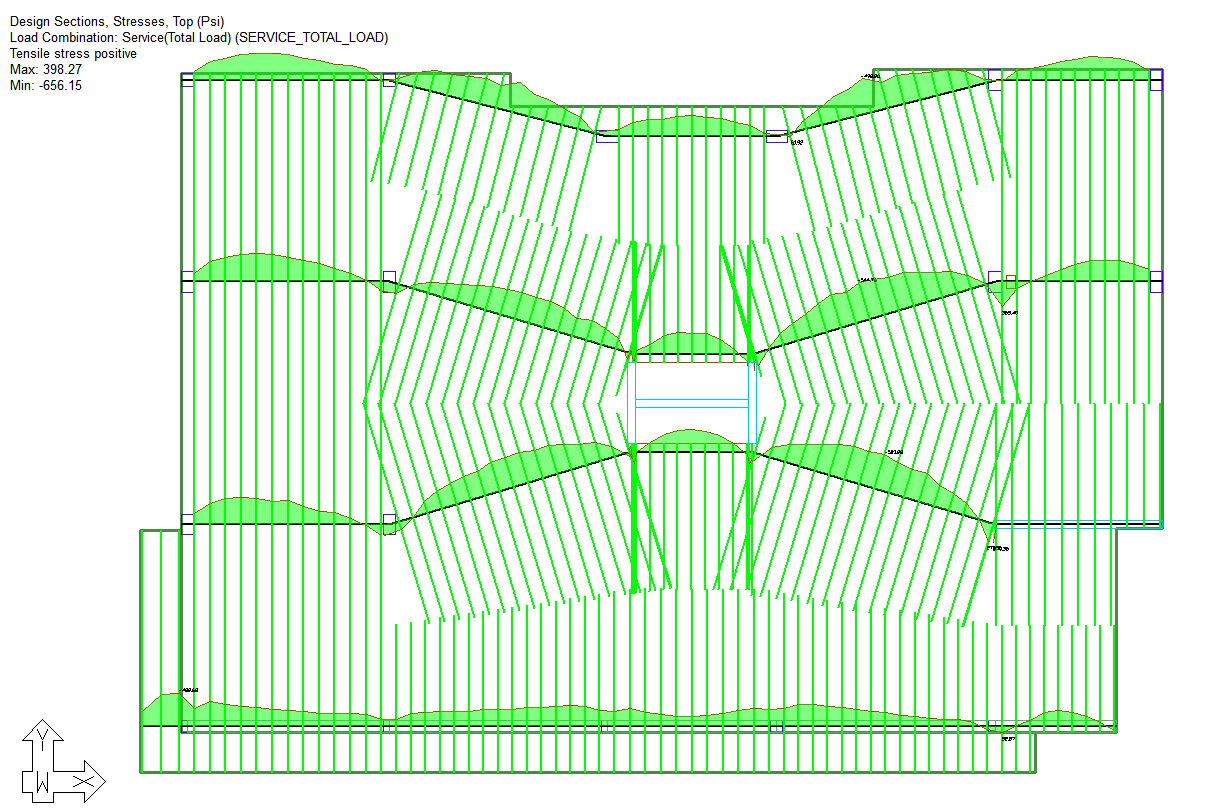
Expand the Stresses tree. In this example we will view the top stress result. Other code checked results can be found in the Deformation, Stresses, Balanced Loading, Investigation, and One-Way Shear Design trees. For a description of each of these results refer to the Results View panel Analysis tab.
-
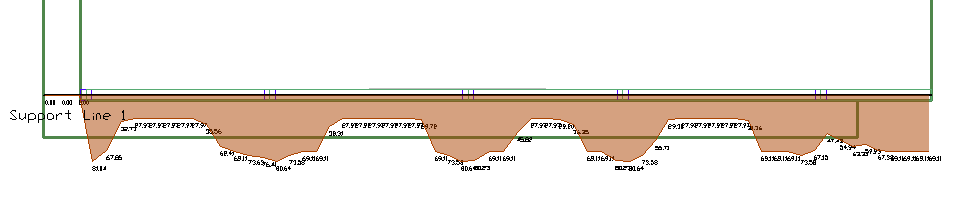
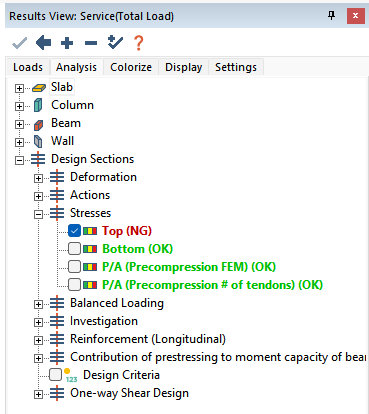
Check the Top result to display the top stresses along the support line. Notice the result text is displayed in red denoting that at least one design section exceeds the allowable stress limit.
-
In the Floor Design ribbon Strip Results/Visibility panel click on the Display/Hide Support Line in X-direction icon to turn on the support lines in the X-direction. You should see the results displayed along the support lines as shown below. Note that all X-direction support lines are colored green denoting that all sections in this direction are within allowable limits.
Click on image to enlarge it
-
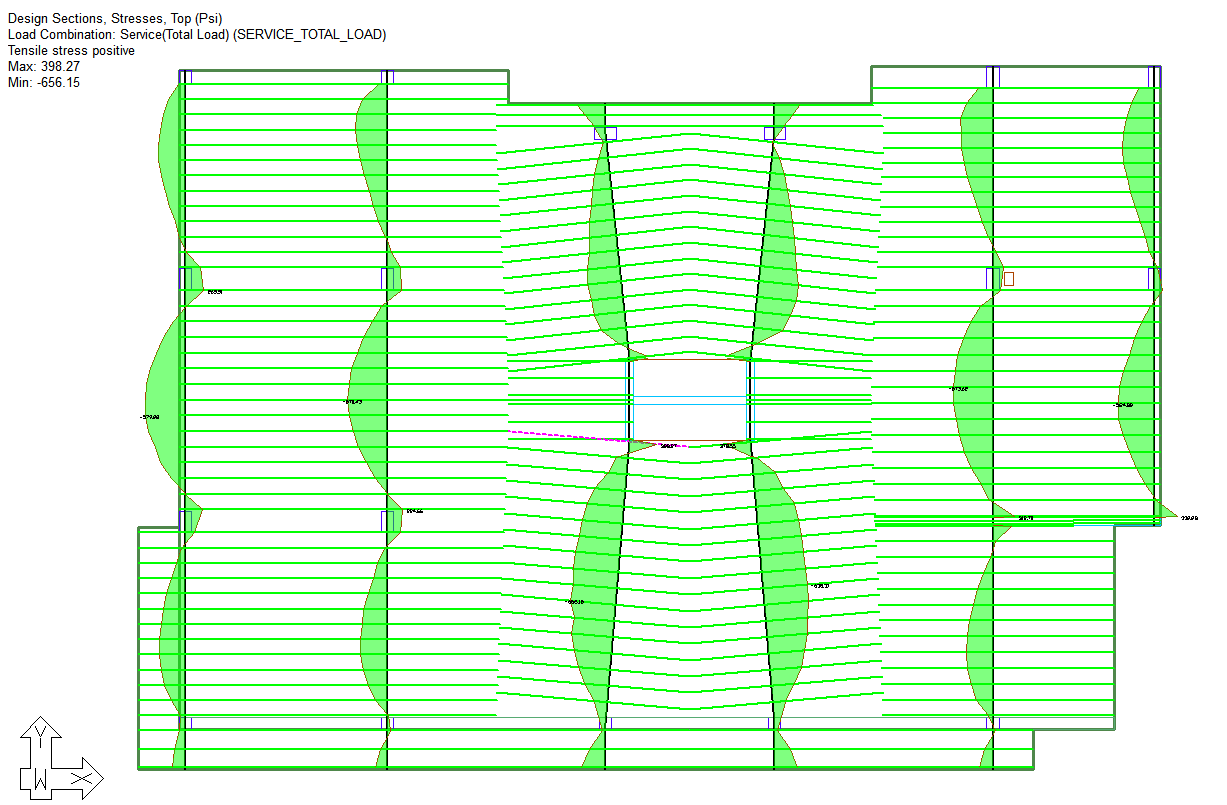
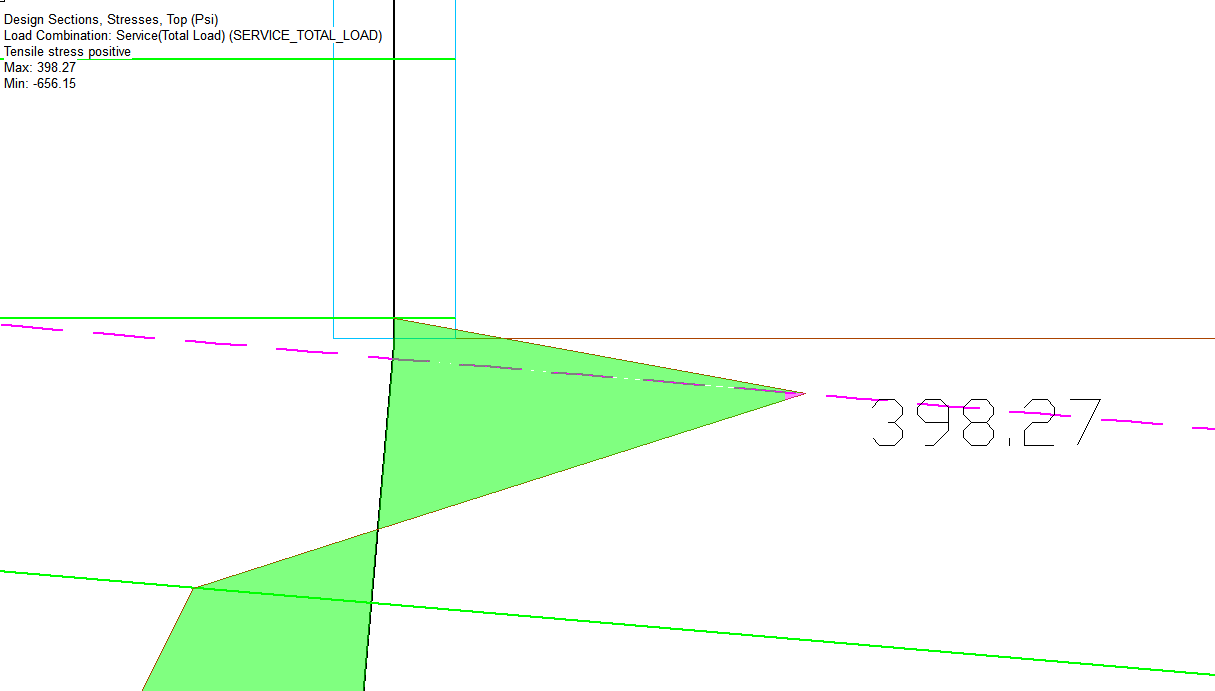
In the Floor Design ribbon Strip Results/Visibility panel click on the Display/Hide Support Line in Y-direction icon to turn on the support lines in the Y-direction. You should see the results displayed along the support lines as shown below. Note that one support line near the center core wall is colored pink with a dashed line denoting that the section exceeds the allowable stress limit.
Click on image to enlarge it
-
Zoom in on the failing design section and we can see the graph is also colored pink denoting stress values that exceed the allowable limit.
Click on image to enlarge it
-
You can modify the display of the results using the tools in the Strip Reults/Visibility panel of the Floor Design ribbon and through the Settings tab of the Result View panel. Please refer to the Floor Design ribbon topic on more information on the Strip/Results Visibility tools and the Results View panel Settings tab topic for more information on the tools in the Results View panel for modifying the display of strip results.
-
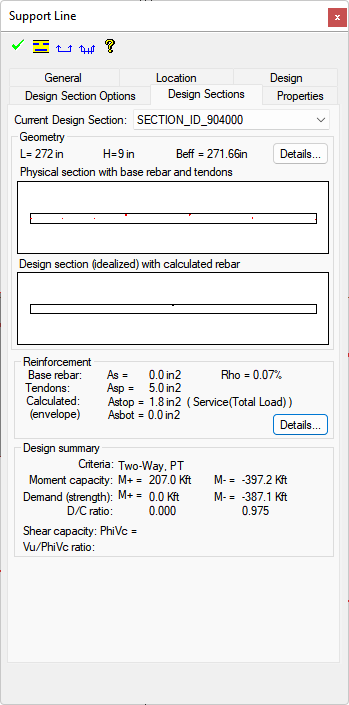
Lastly, you can view more information about the design of the section by double clicking on the section. This will open the support line properties window to the Design Sections tab as shown below. Refer to the Support Line Properties - Design Sections tab topic for more information.
To view one-way shear design results:
-
Click on the Results Display Settings icon of the Bottom Quick Access toolbar to open the Results View panel if it is not already open.
-
In the Results View panel that opens click on the Loads tab.
-
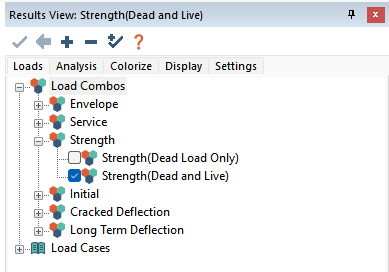
Expand the Load Combos tree and select a combination or an envelope of combinations to view the results for. In the image below we have chosen the Strength (Dead and Live) combination.
Note: The results that can be viewed depend on the load combination chosen. Stresses and crack widths should be checked under a service combination. Two-way and one-way shear are checked under strength combinations.
-
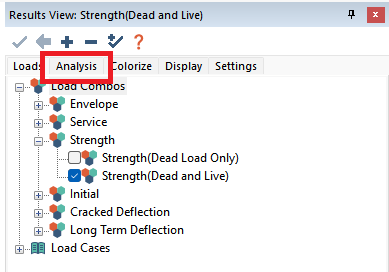
Click on the Analysis tab of the Results View panel.
-
Expand the Design Sections>One-Way Shear Design tree.
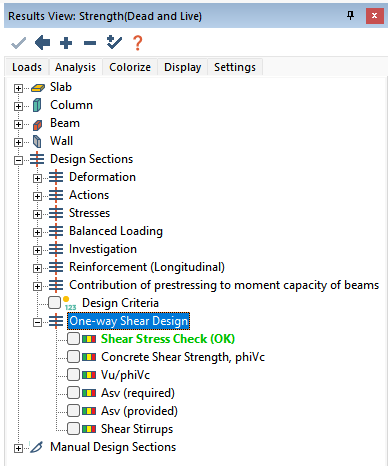
-
Click to mark the check box for a result you want to display along the one-way or beam criteria support lines in your model. In the image below we have selected the Concrete Shear Strength, phiVc result.
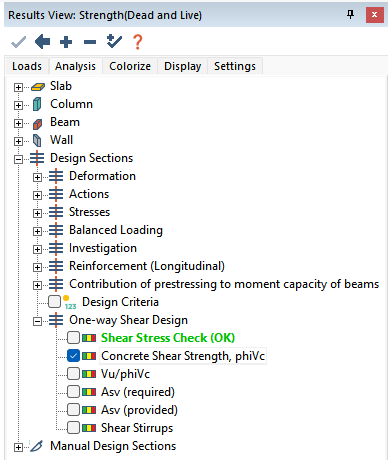
-
The result will display along the support lines whose design criteria is set to One-Way or Beam. An example of the Concrete Shear Strength result is shown below.
Click on image to enlarge it
-
For a description of each result found in the One-way Shear Design tree please refer to the Results View Panel help topic.
Manual Design Section Results
The below sections describe how to view Manual Design Section Results on plan using the Results View panel. Performing a General FEM Analysis and Designing or Investigating the Design Sections must be performed before viewing the results. The below assumes this has been completed before you view the results. The sign convention used for manual design sections is also covered in this section.
Sign convention for manual design sections:
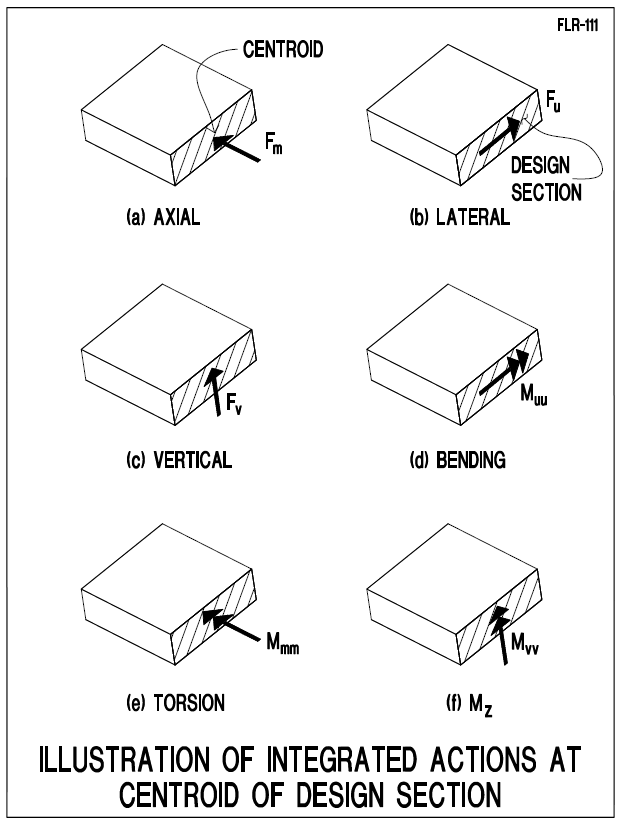
The program resolves the stresses that act on the face of a design section into six actions at the centroid of the design section. The actions consist of three forces and three moments. The six actions along with their designation are illustrated in the below figure.
Click on image to enlarge it
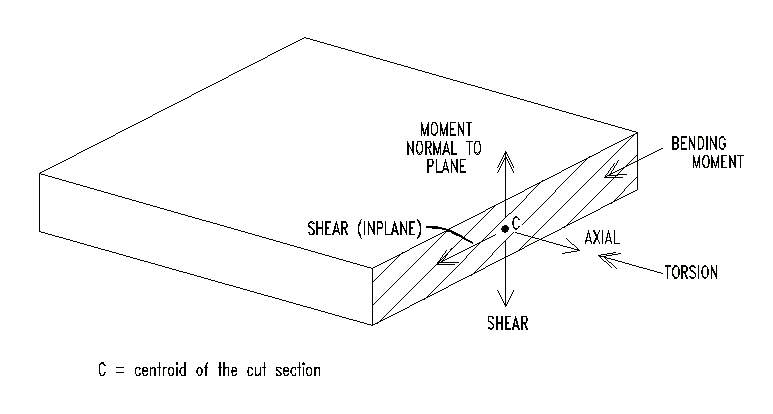
For manually generated design sections, the positive sign of each of the actions is shown below.
Click on image to enlarge it
The value of the actions can be read from the property window of the design section displayed in the figure below.
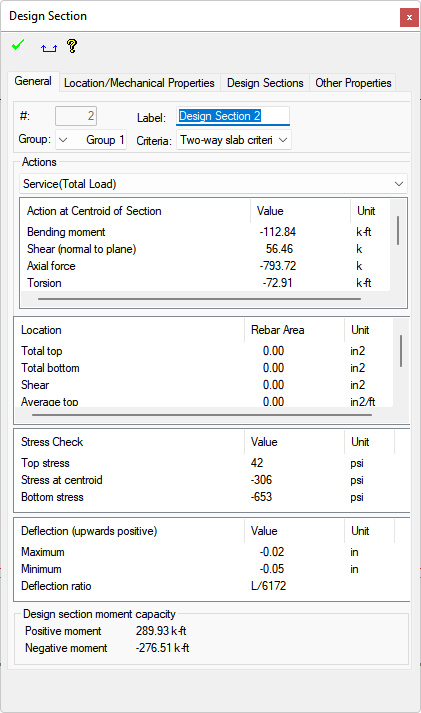
The same sign convention is used for reporting the forces generated by a manual design section in the program’s tabular compilation of the actions. This differs from the sign convention used in the tabular report for automatically generated sections.
To view design section actions:
-
Click on the Results Display Settings icon of the Bottom Quick Access toolbar to open the Results View panel if it is not already open.
-
In the Results View panel that opens click on the Loads tab.
-
Expand the Load Combos tree and select a combination or an envelope of combinations to view the results for. In the image below we have chosen the Service (Total Load) combination.
Note: The results that can be viewed depend on the load combination chosen. Stresses and crack widths should be checked under a service combination. Two-way and one-way shear are checked under strength combinations.
-
Click on the Analysis tab of the Results View panel.
-
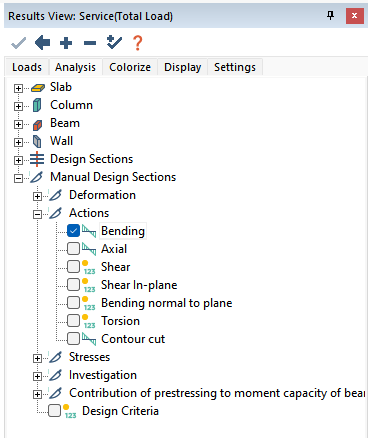
Expand the Manual Design Sections>Actions tree.
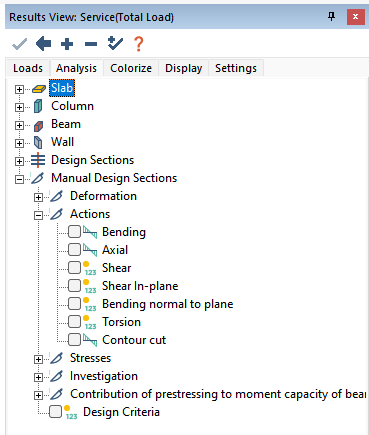
-
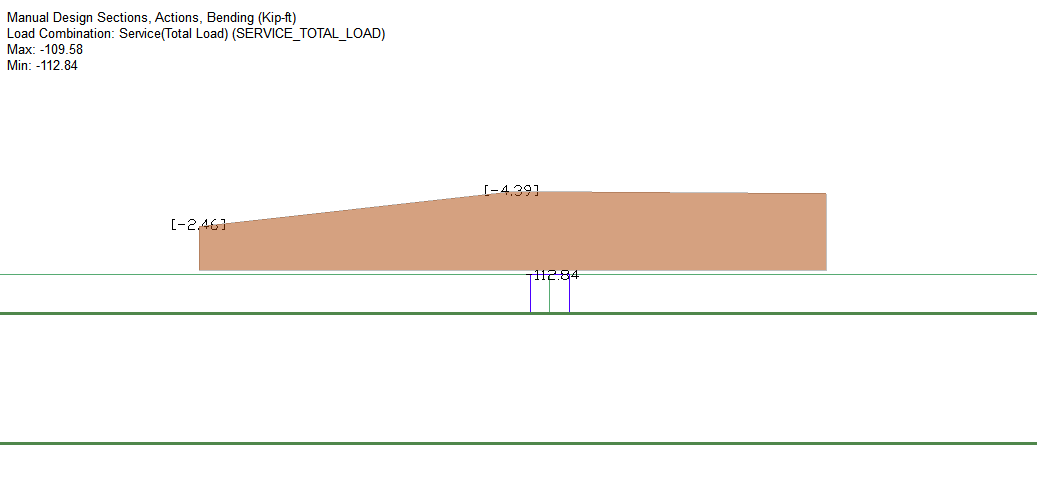
Select the action you want to view the results for. In the below example we have chosen Bending moment.
-
In the Floor Design ribbon Strip Results/Visibility panel click on the Display Manual Design Sections  icon to display the manual design sections on plan. You should see the results displayed along the section as shown below.
Click on image to enlarge it
-
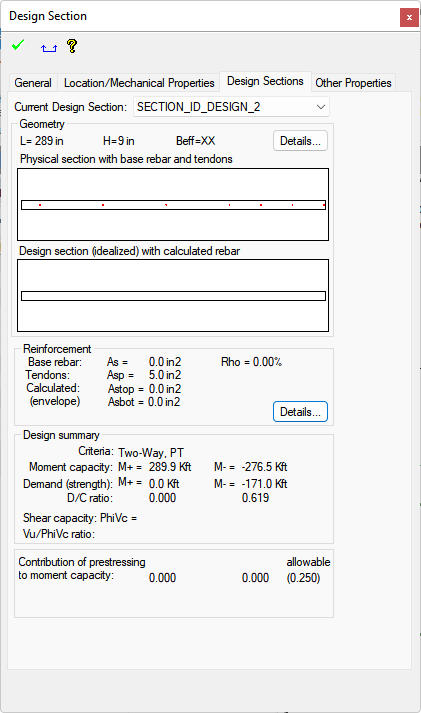
Double click the design section to open its properties window and view more design information.

-
Click on the Design Sections tab to see an elevation of the section as well as detailed results about reinforcement in the section.
-
You can modify the display of the results using the tools in the Strip Reults/Visibility panel of the Floor Design ribbon and through the Settings tab of the Result View panel. Please refer to the Floor Design ribbon topic on more information on the Strip/Results Visibility tools and the Results View panel Settings tab topic for more information on the tools in the Results View panel for modifying the display of strip results.
To view code checked results:
-
Click on the Results Display Settings icon of the Bottom Quick Access toolbar to open the Results View panel if it is not already open.
-
In the Results View panel that opens click on the Loads tab.
-
Expand the Load Combos tree and select a combination or an envelope of combinations to view the results for. In the image below we have chosen the Service (Total Load) combination.
Note: The results that can be viewed depend on the load combination chosen. Stresses and crack widths should be checked under a service combination. Two-way and one-way shear are checked under strength combinations.
-
Click on the Analysis tab of the Results View panel.
-
Expand the Manual Design Sections tree.
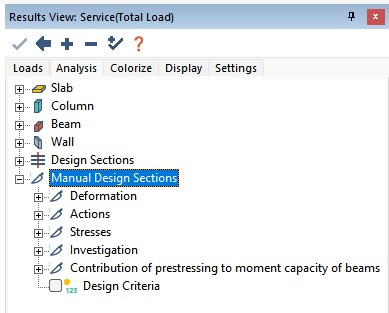
-
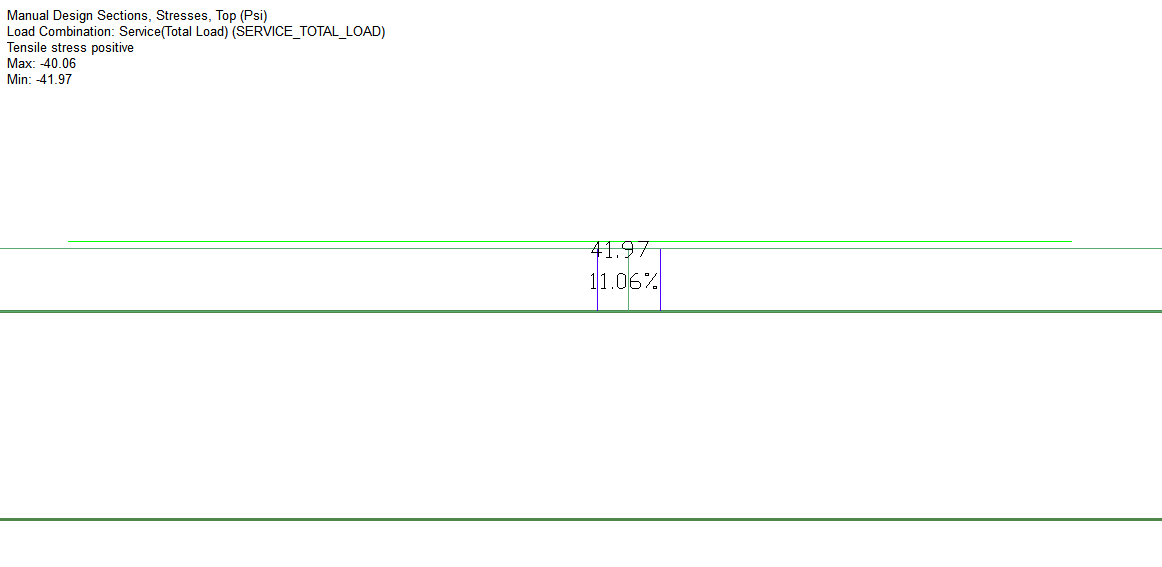
Expand the Stresses tree. In this example we will view the stress result. Other code checked results can be found in the Deformation, Stresses, and Investigation trees. For a description of each of these results refer to the Results View panel Analysis tab.
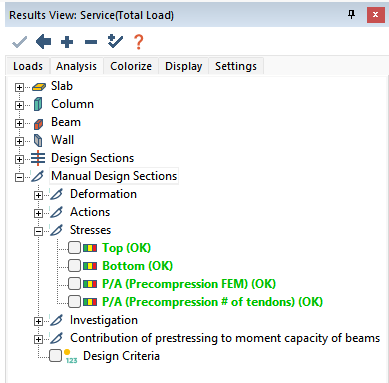
-
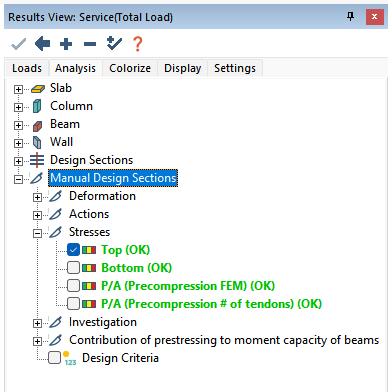
Check the Top result to display the top stresses along the manual design section. Notice the result text is displayed in green denoting that all manual design sections are within the allowable stress limit.
-
In the Floor Design ribbon Strip Results/Visibility panel click on the Display Manual Design Sections icon to display the manual design sections on plan. You should see the results displayed along the section as shown below. The section will be colored in green if the results is within the allowable limit and pink if exceeding the allowable limits. The program reports the stress at the centroid of section as well as the percentage of the allowable stress that is used.
Click on image to enlarge it
-
You can modify the display of the results using the tools in the Strip Reults/Visibility panel of the Floor Design ribbon and through the Settings tab of the Result View panel. Please refer to the Floor Design ribbon topic on more information on the Strip/Results Visibility tools and the Results View panel Settings tab topic for more information on the tools in the Results View panel for modifying the display of strip results.
-
Lastly, you can view more information about the design of the section by double clicking on the section. This will open the support line properties window to the design section tab as shown below. Refer to the Support Line Properties - Design Sections tab topic for more information.
View Tabular Design Section Results
In addition to graphical results, ADAPT-Builder will also report the design section results in tabular format. This section describes how to view those results. Performing a General FEM Analysis and Designing or Investigating the Design Sections must be performed before viewing the results. The below assumes both have been completed before you view the results.
To view singular tabular design section reports:
Note: Depending on the size of the model and number of design sections and combinations you choose to view the result for, the reports can become very large in size. Some word processors have a file size limitation. If this limitation is hit you may need to create reports for a selected number of support lines at a time in order to create the report for all design sections in the model.
-
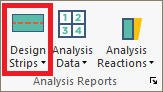
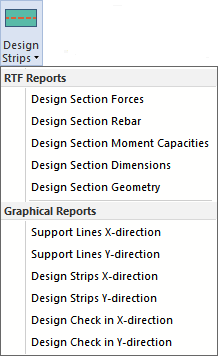
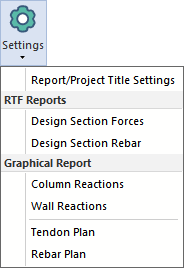
Go to Report>Analysis Reports panel and locate the Design Strips drop down icon.
-
Click on the Design Strips drop down icon to expand the icon and see the different reports available.
-
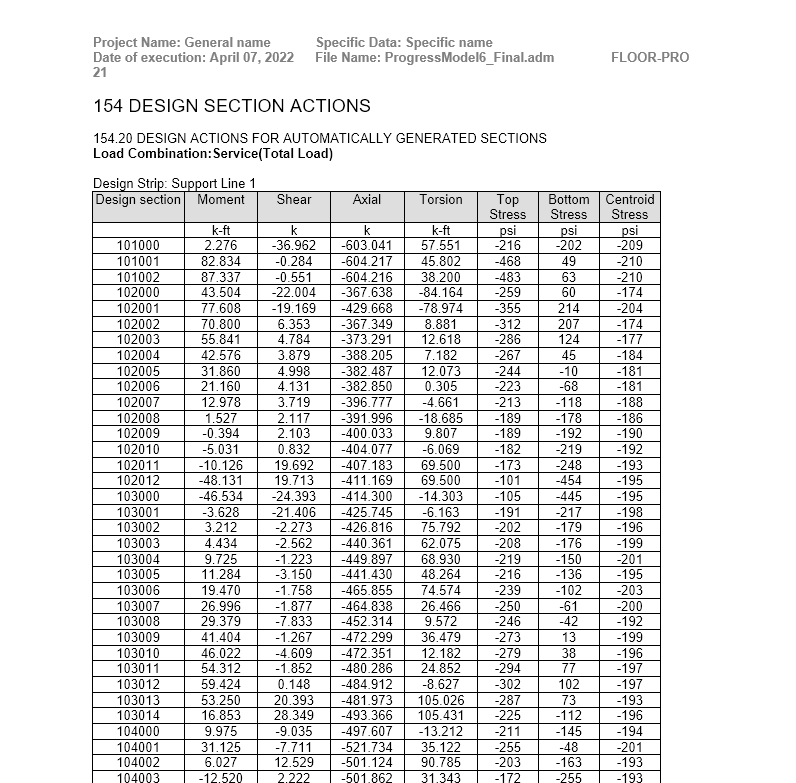
Select the report from the RTF Reports section that you want to view the tabular results for. For the Design Section Moment Capacities, Dimensions, and Geometry reports the report will open in the default word processor on the computer. Below is an image of the Design Section Forces report when opened in a word processor.
Click on image to enlarge it
-
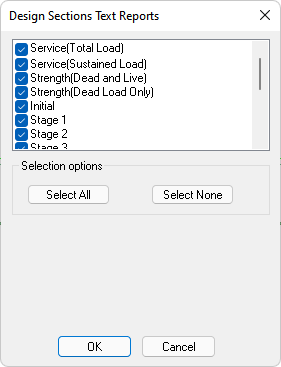
If you choose the Design Section Forces report or the Design Section Rebar report, a separate dialog window will open as shown below.
-
Design Section Forces dialog. Select the combinations you want to include in the Design Section Forces tabular report and click OK to generate the report.
-
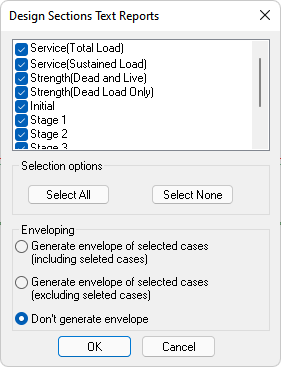
Design Section Rebar dialog. Select the combinations and enveloping options that you want to use to create the Design Section Rebar tabular report and click OK to generate the report.
-
Once the reports have been generated they can be found in the Reports sub folder within the solution folder. The solution folder is the folder with the same name as the Builder (.adm) file that accompanies the .adm file.
To view compiled tabular design section reports:
Note: Depending on the size of the model and number of design sections and combinations you choose to view the result for, the reports can become very large in size. Some word processors have a file size limitation. If this limitation is hit you may need to create reports for a select number of sections at a time in order to create the report for all design sections in the model.
-
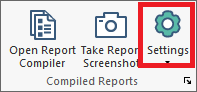
Go to Report>Compiled Reports panel and locate the Settings drop down icon.
-
Click on the Settings drop down icon to expand the icon and see the different reports available.
-
Click on the Design Section Forces and the Design Section Rebar options a separate pop up window will open.
- Design Section Forces dialog. Select the combinations you want to include in the Design Section Forces tabular report and click OK to store the settings. The settings will be used by the report compiler when creating the compiled report.
-
Design Section Rebar dialog. Select the combinations and enveloping options that you want to use to create the Design Section Rebar tabular report and click OK to store the settings. The settings will be used by the report compiler when creating the compiled report.
-
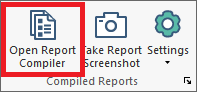
Go to Reports>Compiled Reports and click on the Open Report Compiler icon.
-
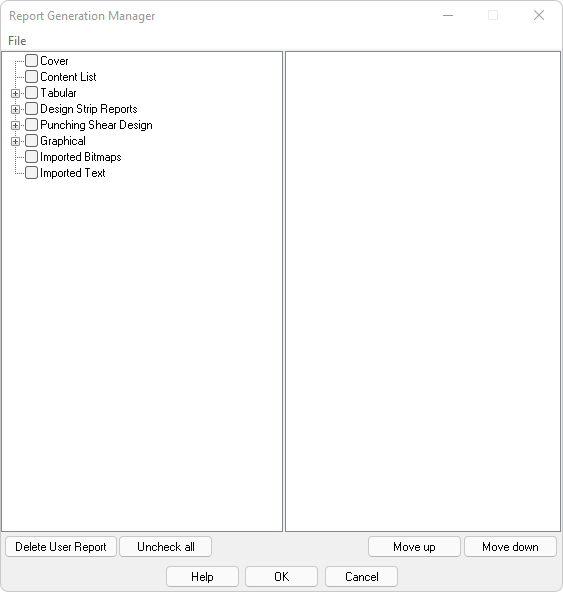
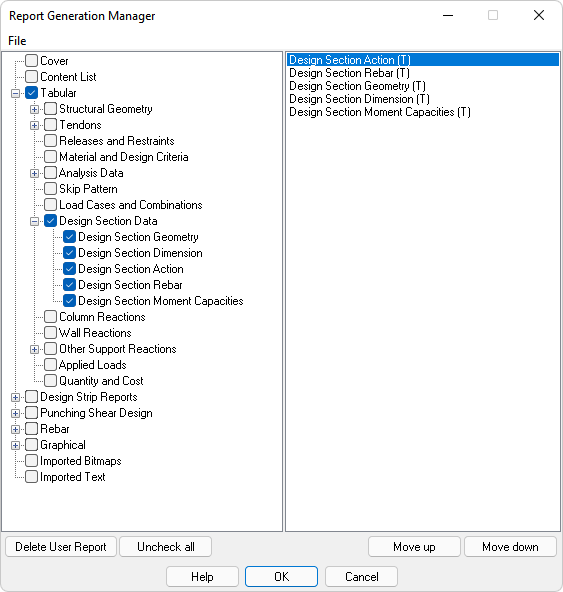
The Report Generation Manager will open as shown below.
-
Expand the Tabular>Design Section Data tree.
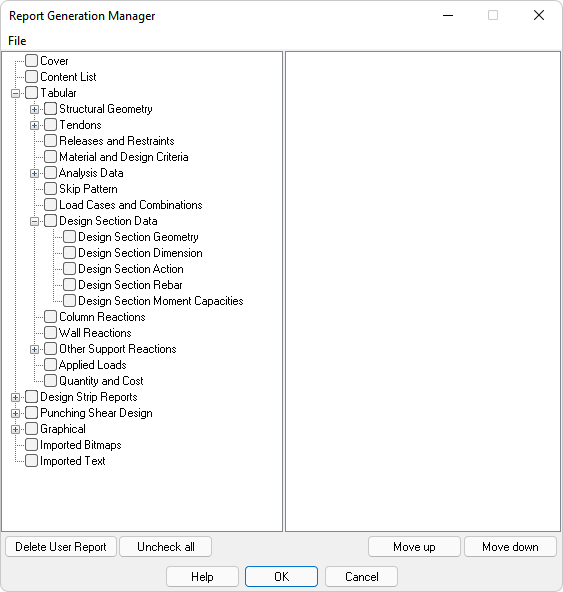
-
Check the reports you want to include in the compiled report. In the example below we have selected all Design Section Data reports. The reports will populate in the right pane of the Report Generation Manager.
-
Use the Move up and Move down buttons to order the reports in the right pane to be in the order you want them included in the compiled report.
-
In the Report Generation Manager window go to File>Generate Compiled Report and select the RTF Report option. The compiled report will generate and open in the default word processor of the machine.
-
Once the reports have been generated they can be found in the Reports sub folder within the solution folder. The solution folder is the folder with the same name as the Builder (.adm) file that accompanies the .adm file.